
****
As the Australian wind industry’s house of cards collapses, its parasites and paid spruikers – like the Clean Energy Council – have been working up a real sweat in their efforts to make a case for the retention of the mandatory Renewable Energy Target – upon which that house of cards entirely depends.
All manner of fictions are being relied upon, most of which we’ve all heard before – crackers like: wind power has REDUCED household power bills; wind power has created thousands of “green” jobs; wind power is cost competitive with conventional power generation sources; and that giant fans are literally sucking CO2 out of the atmosphere.
In this episode of STT Mythbusters, we thought we’d tackle 3 of the biggest myths peddled about wind power by its dwindling group of hard-pressed supporters.
Myth #1: “the distributed network myth”.
This is the often told tale about wind power providing “base-load” power (ie available on-demand and around-the-clock) when wind farms are spread over a large geographical area and connected to the same grid. This myth is based on the story that the “wind is always blowing somewhere” – spread fans far and wide and there will always be oodles of wonderful “free” wind power available on-demand.
Myth #2: “wind farms in Australia produce enough energy to power 1.7m homes”.
Variants of this myth pop up as: “the Woodlawn [or insert name] wind farm will “power” 32,000 homes [or simply insert any made-up figure you like]” (see our post here).
Myth #3: “wind power is a substitute for fossil fuel generation sources”.
This myth is trotted out to support wild claims about wind power completely displacing coal and gas-fired power plants, thereby eliminating CO2 emissions in the electricity sector, altogether. This myth is tied up with Myth #1 – relying upon the myth that wind power provides “base-load” power. One lesser version of the myth is that wind power is capable of being a perfect substitute for coal and gas (some day) – provided that 10s of thousands of new giant fans are added to the grid.
At STT Mythbusters we don’t just tell the myths, we put them to the test. So let’s take a look at some data from the last month, courtesy of http://windfarmperformance.info/.
In this episode, we’ll look at data for the entire Eastern Grid – which covers every wind farm in Victoria, Tasmania and New South Wales, as well as including the 1,203 MW of installed capacity that comes from Australia’s “wind power capital” – South Australia. All of these wind farms are connected to the Eastern Grid and together have a total installed capacity of 2,660 MW. Oh, and if our data looks a little fuzzy, click on the image, it will pop up in a new window, use your magnifier and it will look crystal clear.

Entire Eastern Grid – 16 April 2014 – from 8am to 12 noon (4hrs) and from 6pm to midnight (6hrs):
Total wind farm output: 8am to 12 noon – less than 165 MW, falling to 90 MW; 6pm to midnight – less than 80 MW, falling to less than 50 MW.
Output as a percentage of total installed wind farm capacity: 8am to 12 noon – 6.2%, falling to 3.3%; 6pm to midnight – 3%, falling to 1.9%.
Total demand (average): 22,000 MW.
Contribution to total demand as a percentage: 0.75%, falling to 0.22%.
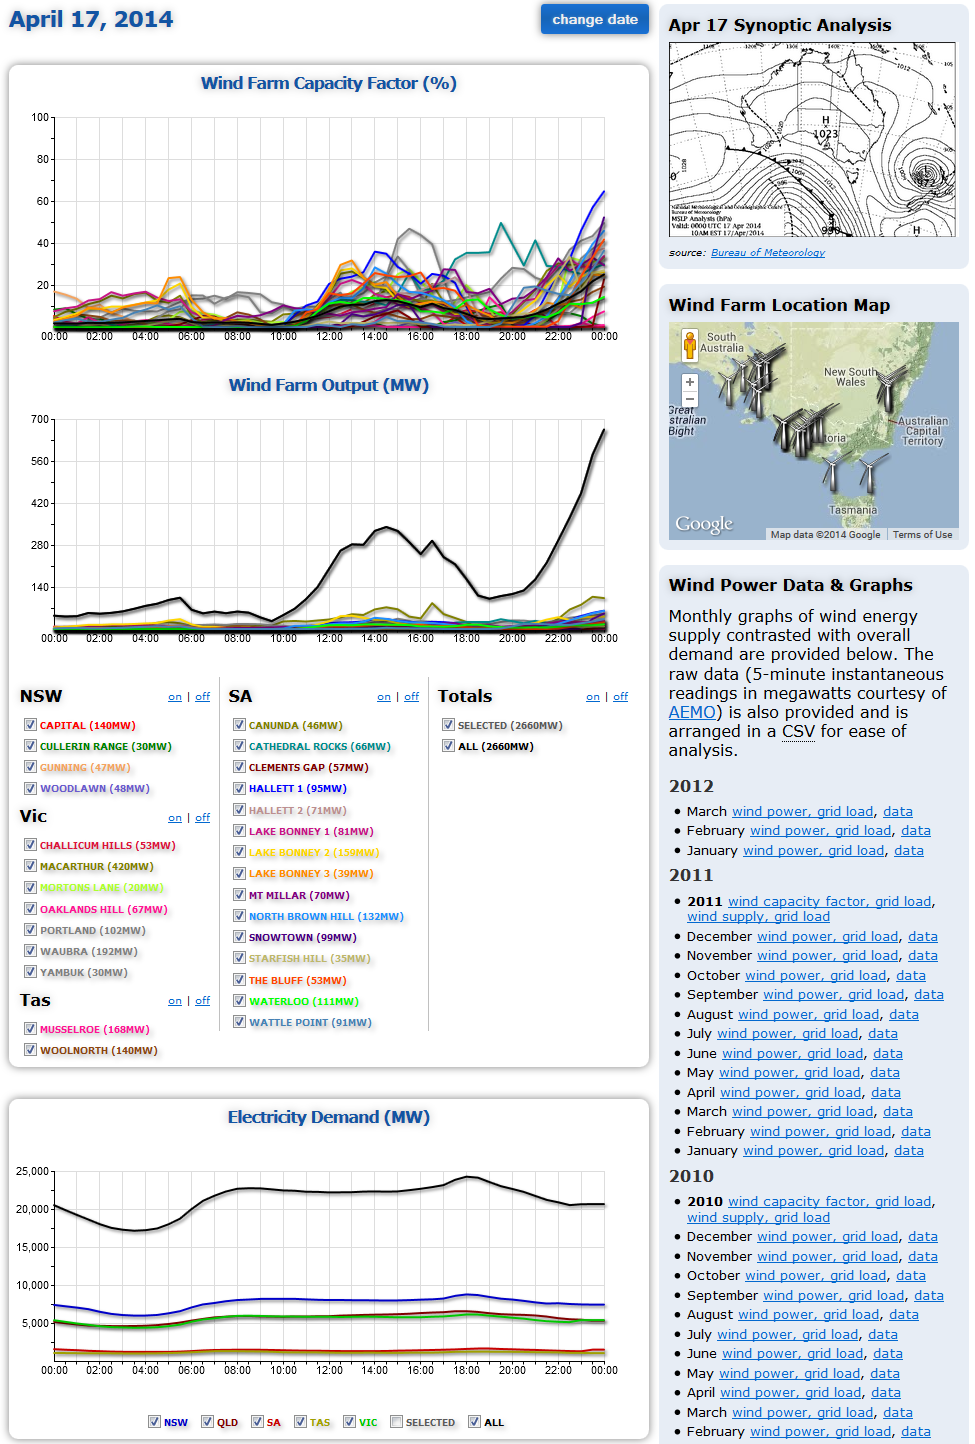
Entire Eastern Grid – 17 April 2014 – from midnight to 11am (11hrs) and from 6pm to 9pm (3hrs):
Total wind farm output: midnight to 11am – less than 80 MW and generally less than 60 MW; 6pm to 9pm – less than 140 MW, falling to 80 MW.
Output as a percentage of total installed wind farm capacity: midnight to 11am – 3%, falling to 2.2%; 6pm to 9pm – 5.2%, falling to 3%.
Total demand (average): 22,000 MW.
Contribution to total demand as a percentage: midnight to 11am and 6pm to 9pm – between 0.27% and 0.63%.
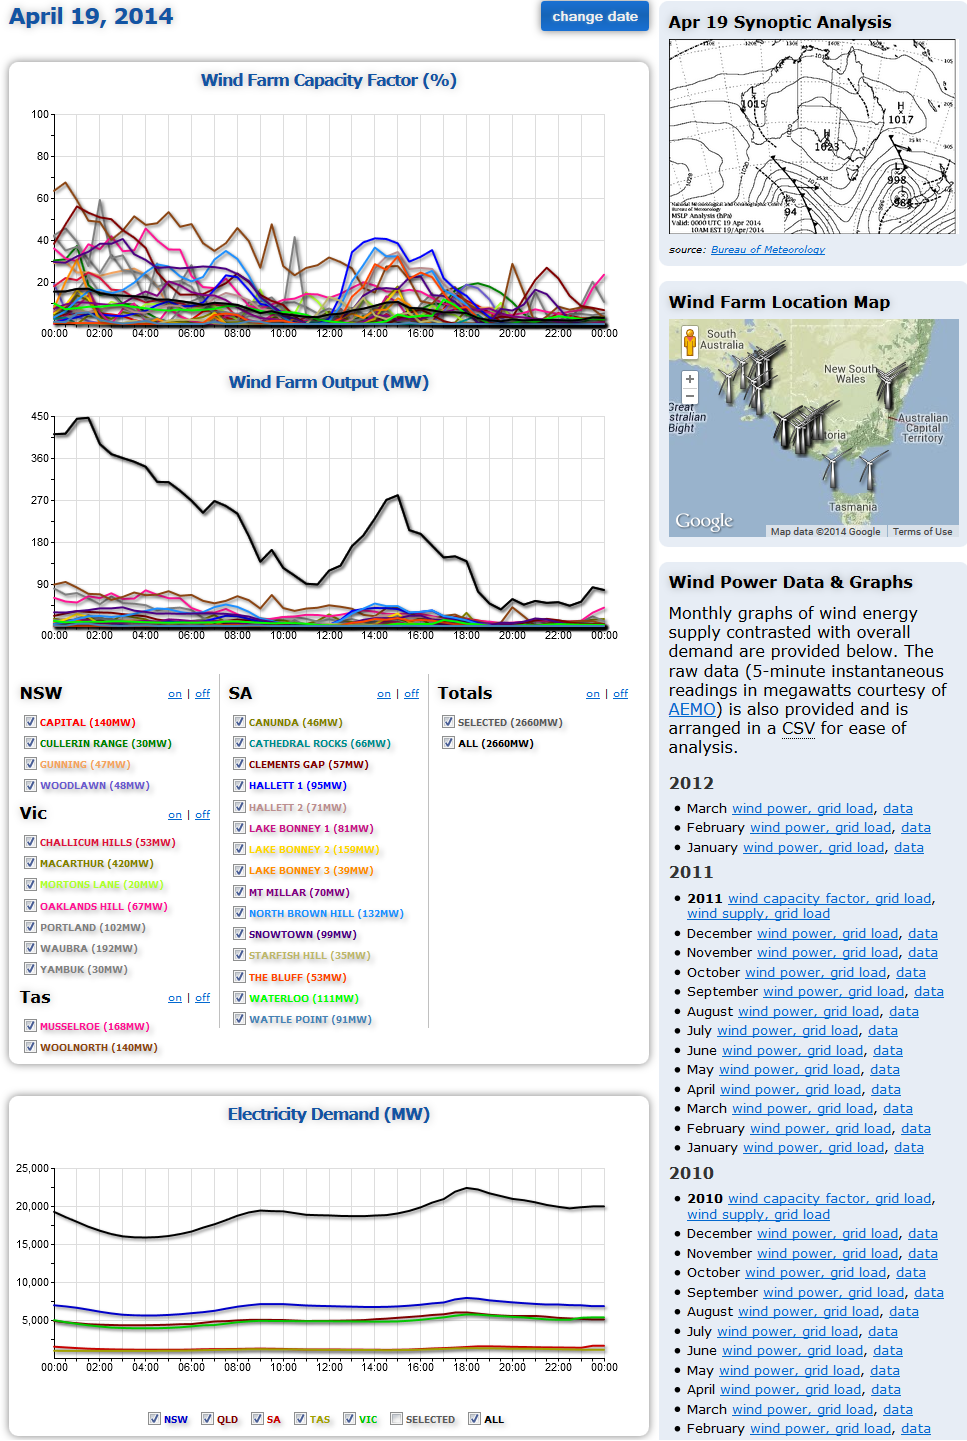
Entire Eastern Grid – 19 April 2014 – from 8am to 1pm (5hrs) and from 7pm to 11pm (4hrs):
Total wind farm output: 8am to 1pm – less than 180 MW, falling to 90 MW; 7pm to 11pm – around 45 MW.
Output as a percentage of total installed wind farm capacity: 8am to 1pm – between 3.4% and 6.7%; 7pm to 11pm – 1.7%.
Total demand (average): 19,000 MW.
Contribution to total demand as a percentage: 8am to 1pm and 7pm to 11pm – between 0.23% and 0.94%.

Entire Eastern Grid – 30 April 2014 – from 8am to midnight (16hrs):
Total wind farm output: 8am to midnight – never more than 380 MW, generally less than 300 MW, and falling to less than 40 MW (10pm to midnight).
Output as a percentage of total installed wind farm capacity: 8am to 10pm – between 5% and 14%; 10pm to midnight – 1.5%.
Total demand (average): 23,500 MW.
Contribution to total demand as a percentage: 8am to midnight – between 0.17% and 1.62%.
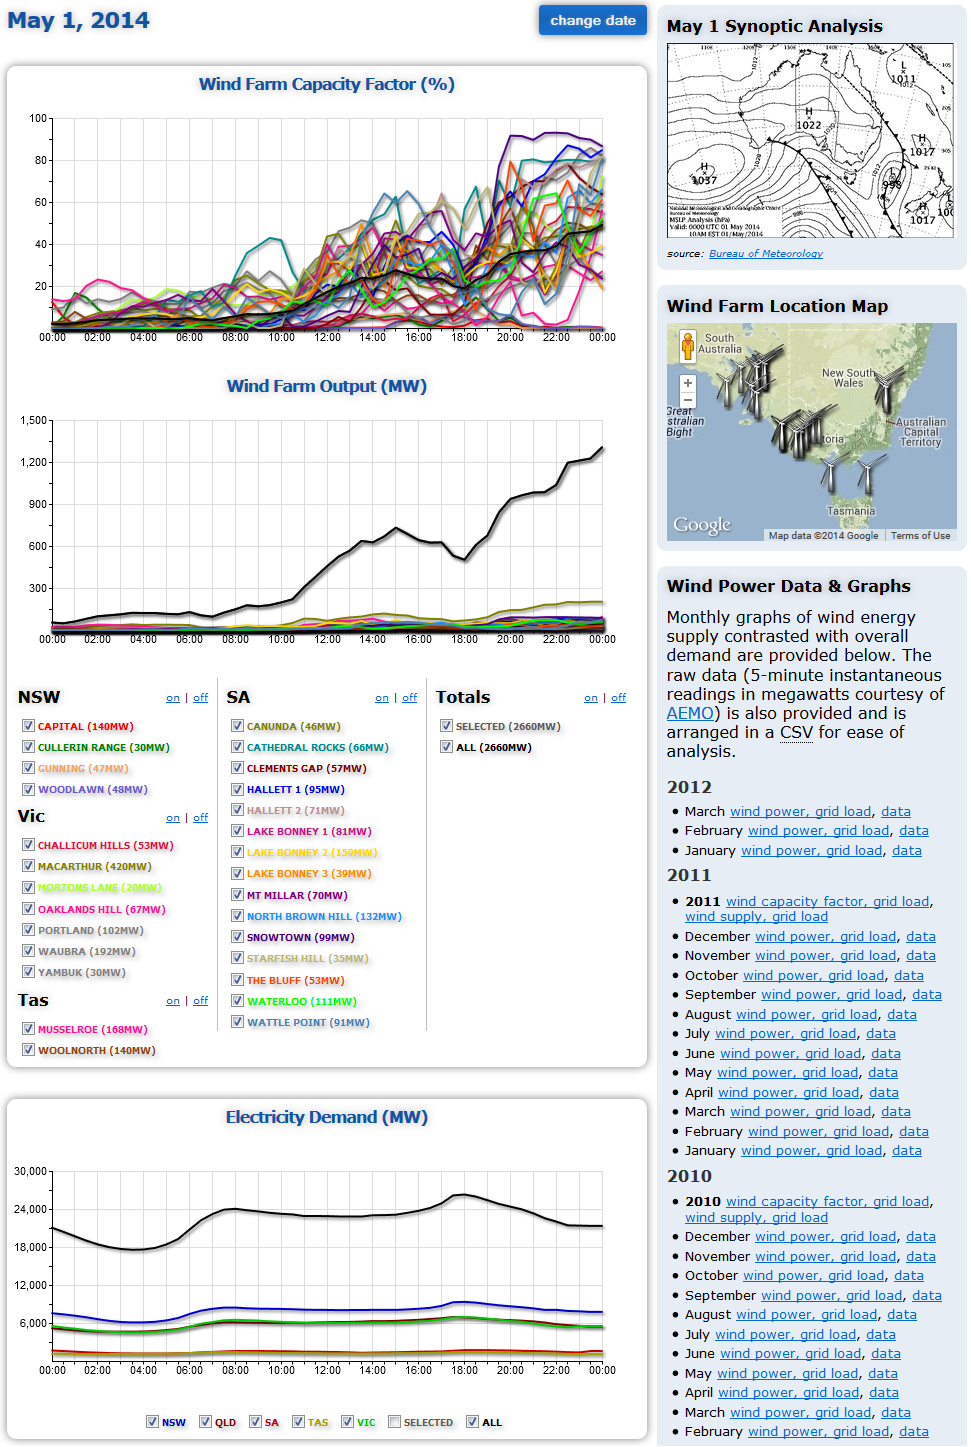
Entire Eastern Grid – 1 May 2014 – from midnight to 10am (10hrs):
Total wind farm output: midnight to 10am – never more than 150 MW and generally less than 100 MW.
Output as a percentage of total installed wind farm capacity: midnight to 10am – between 3.75% and 5.6%.
Total demand (average): 23,500 MW.
Contribution to total demand as a percentage: midnight to 11am – between 0.42% and 0.64%.
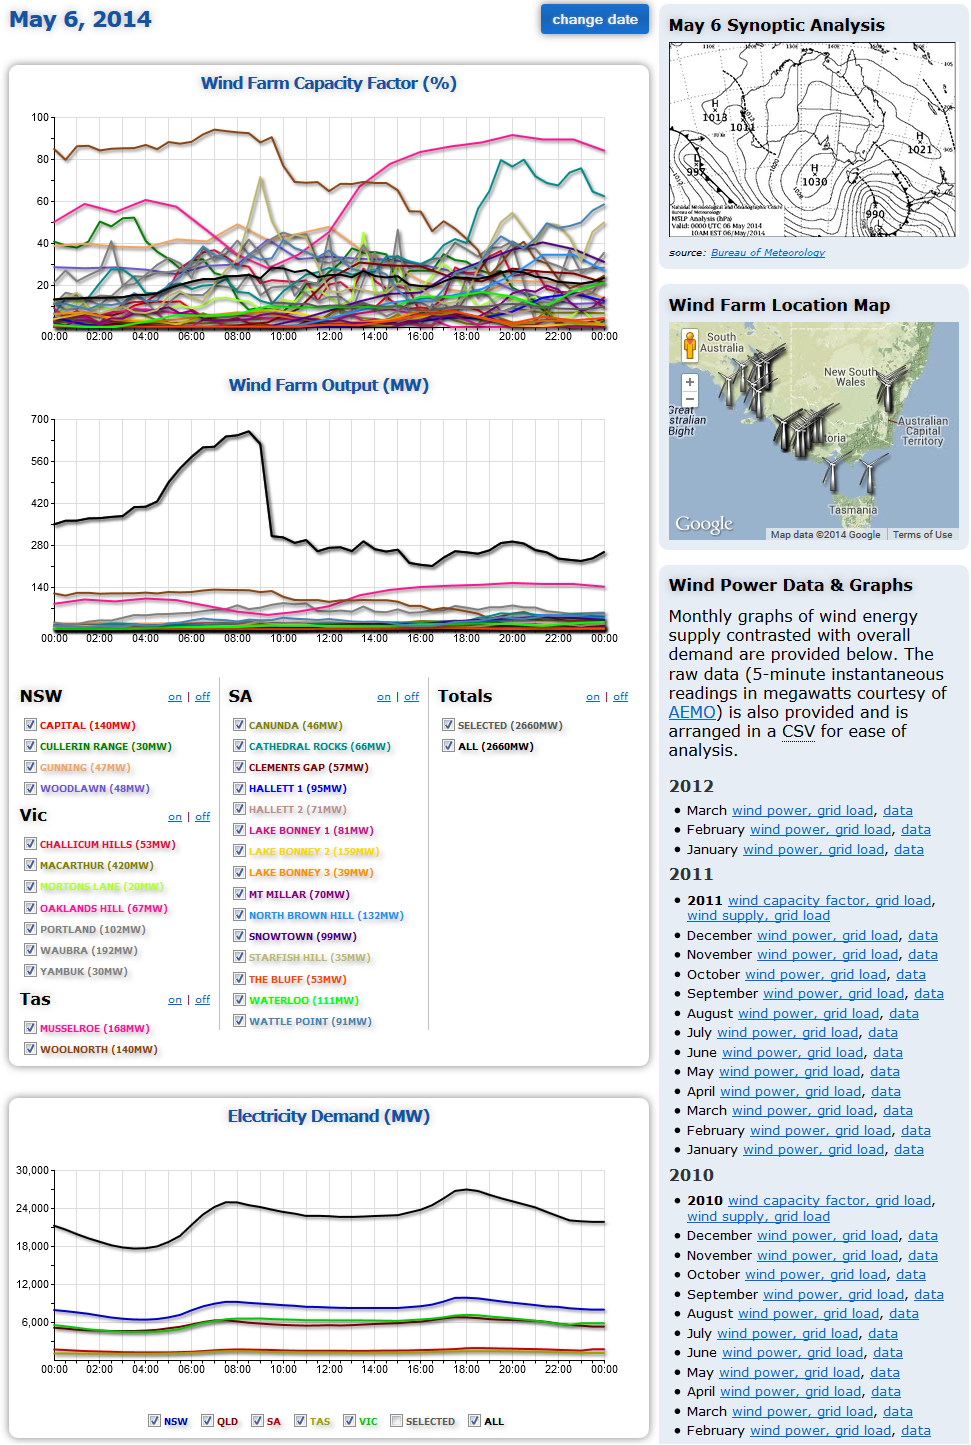
Entire Eastern Grid – 6 May 2014 – from 10am to midnight (14hrs):
Total wind farm output: from 10am to midnight – never more than 280 MW, dipping to 210 MW around 3pm.
Output as a percentage of total installed wind farm capacity: from 10am to midnight – around 10.5%, dipping to 7.8% around 3pm.
Total demand (average): 23,500 MW.
Contribution to total demand as a percentage: 10am to midnight – between 0.89% and 1.2%.
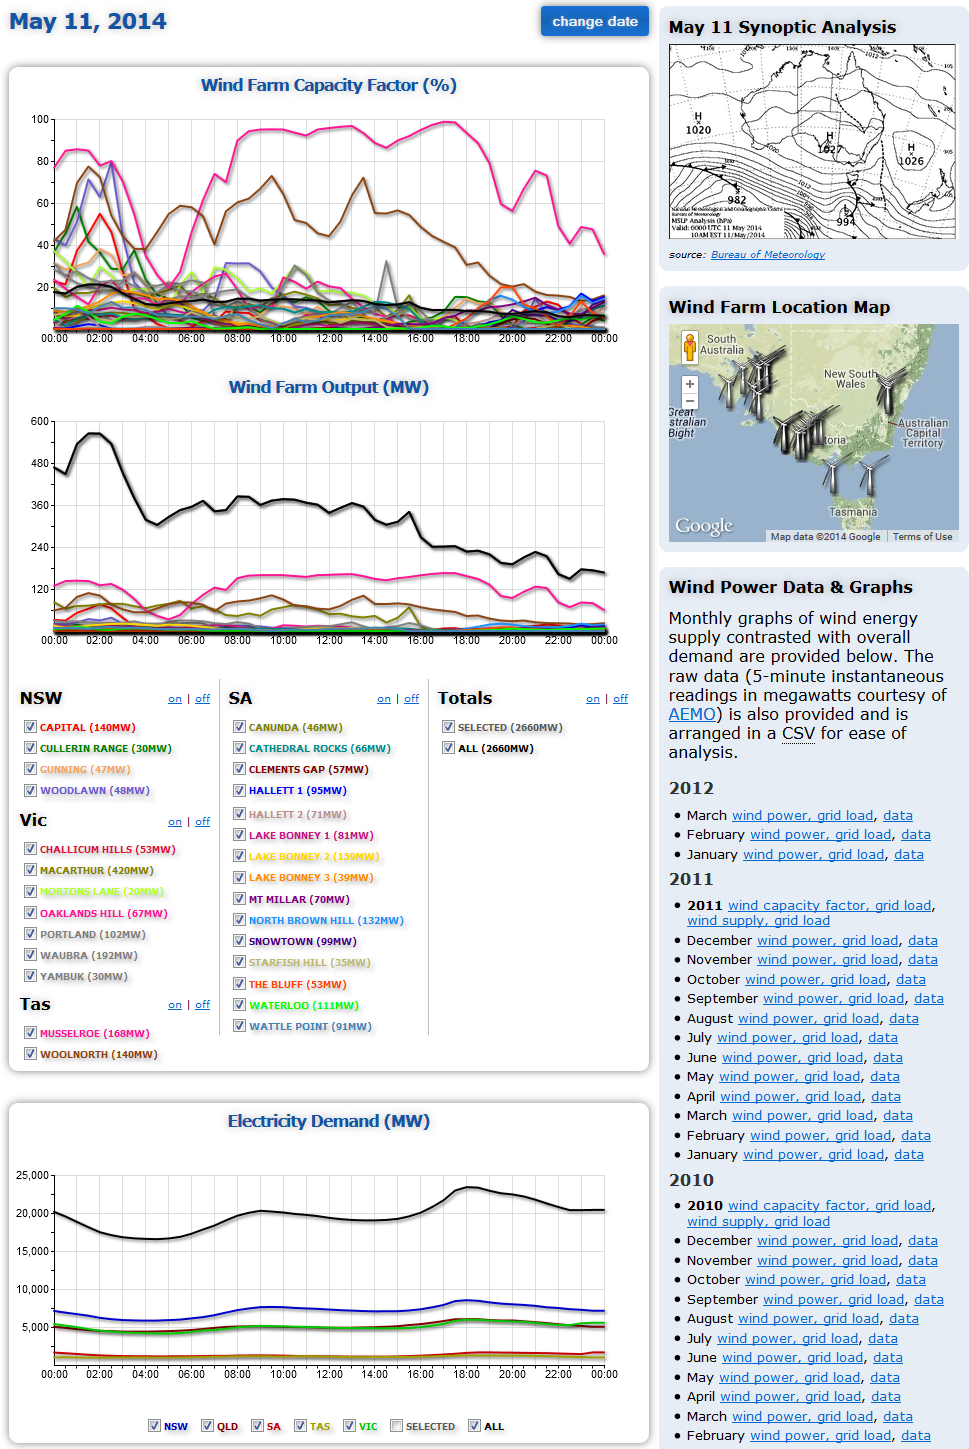
Entire Eastern Grid – 11 May 2014 – from 4am to 4pm (12hrs); and 5pm to midnight (7hrs):
Total wind farm output: from 4am to 4pm – never more than 370 MW; from 5pm to midnight – never more than 240 MW, dipping to 130 MW around 11pm.
Output as a percentage of total installed wind farm capacity: from 4am to 4pm – around 14%; from 5pm to midnight – around 9%, dipping to 4.9% around 11pm.
Total demand (average): 21,500 MW.
Contribution to total demand as a percentage: 4am to midnight – between 0.60% and 1.72%.
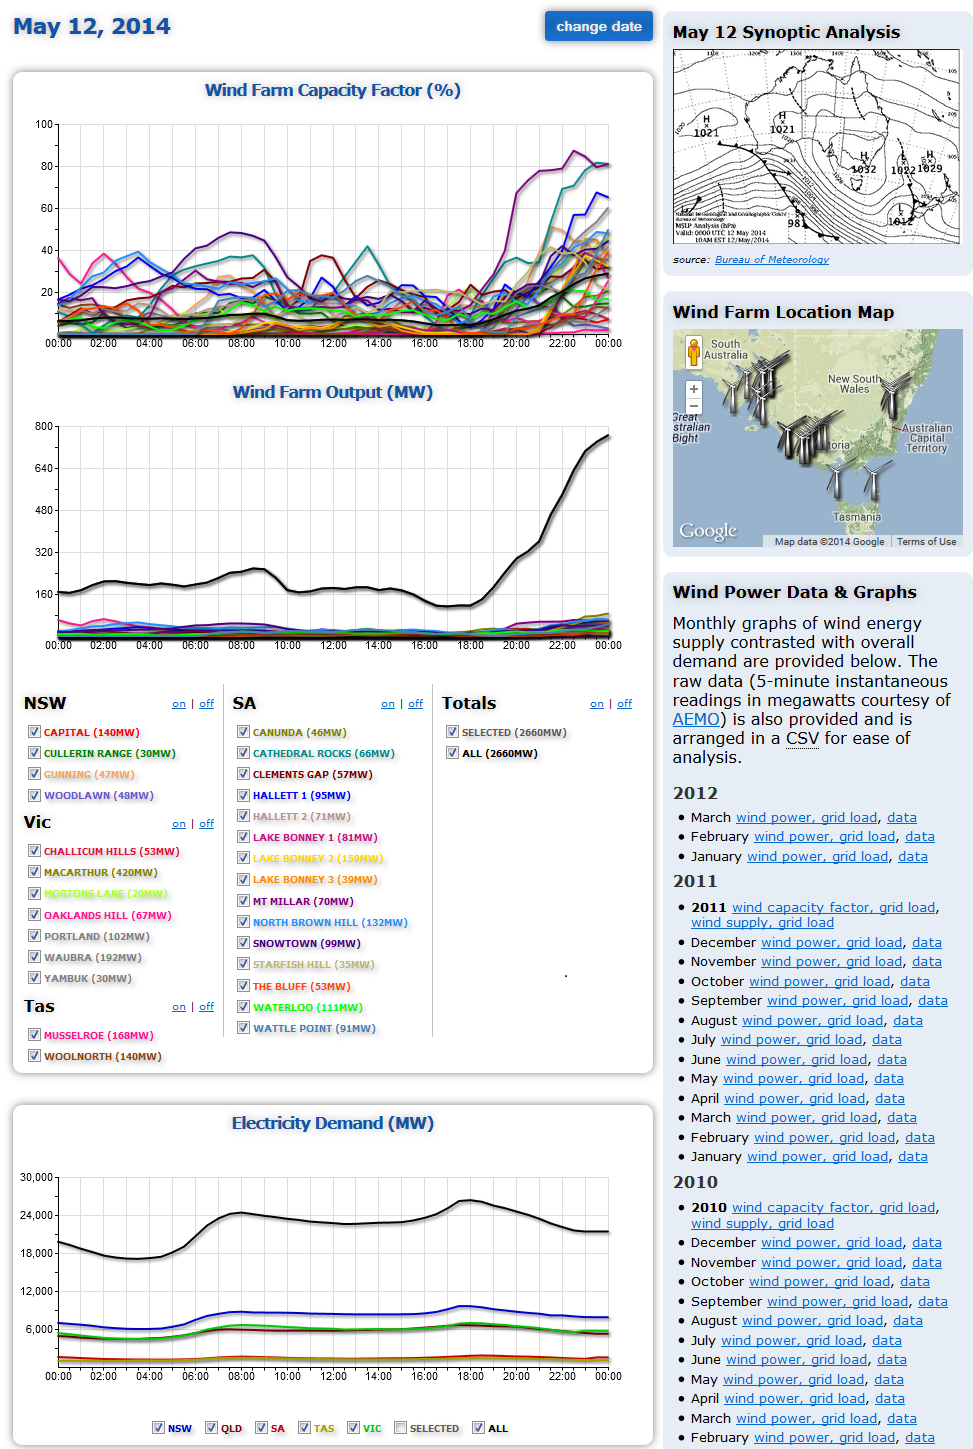
Entire Eastern Grid – 12 May 2014 – from midnight to 7pm (19hrs):
Total wind farm output: (from midnight to 7pm) never more than 240 MW, generally less than 170 MW and dipping to around 100 MW between 5pm and 6pm.
Output as a percentage of total installed wind farm capacity: from midnight to 7pm – no more than 9%, generally around 6.4% and dipping to 3.8% around 5pm.
Total demand (average): 23,500 MW.
Contribution to total demand as a percentage: (from midnight to 7pm) between 0.42% and 1.02%.
For more STT Mythbuster’s data see our posts here and here and here and here and here and here.
Now back to the workshop with the data to test the myths.
Myth #1: “the distributed network myth”.
****
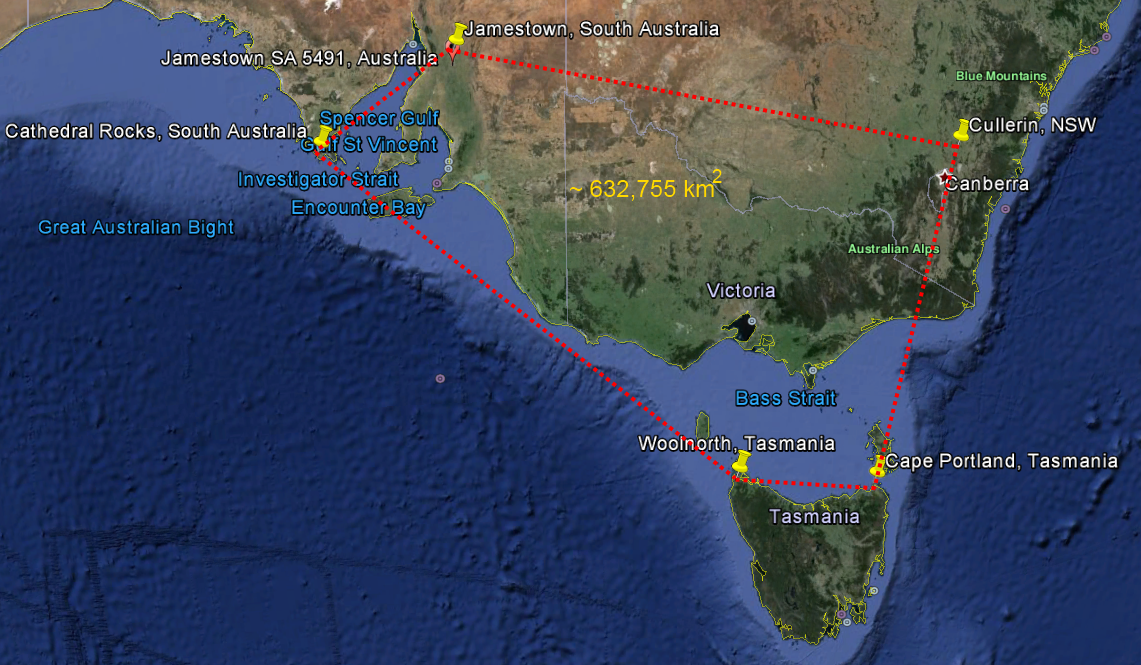
On the Eastern Grid Australia’s wind farms are spread from: Jamestown in the Mid-North, west to Cathedral Rocks on lower Eyre Peninsula and south to Millicent in South Australia; down to Cape Portland (Musselroe) and Woolnorth (Cape Grim) in Tasmania; all over Victoria; and right up to Cullerin on the New South Wales Tablelands.
Those wind farms have hundreds of fans spread out over a geographical expanse of 632,755 km². That’s an area which is 2.75 times the combined area of England (130,395 km²) Scotland (78,387 km²) and Wales (20,761 km²) of 229,543 km².
Nowhere else in the world are so many interconnected wind farms spread over such a large geographical expanse. If there was a shred of substance to the distributed network myth, then we’d see it in the data above. But it just ain’t there.
When you have 2,660 MW of installed capacity – connected and spread over an area more than twice the size of Great Britain – producing less than 200 MW for hours on end – and, on plenty of occasions, less than half that figure – the idea that wind power is providing (or could ever provide) “base-load” power – or even power “on demand” – by having wind farms spread far and wide is just silly.
Verdict: Myth #1 – BUSTED.
Myth #2: “wind farms in Australia produce enough energy to power 1.7m homes”.
True it is that, STT Mythbusters has only presented data from the Eastern Grid, overlooking the roughly 420 MW of installed wind farm capacity in Western Australia (which represents around 14% of the 3,080 MW Australian total). So let’s test Myth # 2 as a myth about “Eastern Australian wind farms “powering” 1.4 million homes.”
At STT Mythbusters the term “powering” means exactly what it says: that when someone – at any time – in any and all of those 1.4 million homes flicks the switch the lights go on or the kettle starts boiling.
The claim about wind farms powering 1.4 million homes depends upon all 2,660 MW of total installed capacity operating and pumping all of that power into the grid.
So, how many homes were, in fact, “powered” by wind farms on 12 May 2014 when – from midnight to 7pm (a period of 19 hours) – every single fan hooked up to the Eastern Grid never produced more than 240 MW, generally produced less than 170 MW and was producing about 100 MW around 5-6pm that day?
STT Mythbusters viewers can run the numbers on any of the data we’ve gathered, and get much the same results.
On rare and brief occasions – and then only for very short spurts – the installed wind farm capacity connected to the Eastern Grid has generated around 2,000 MW, but for the most part produces half that and much, much less.
Hundreds of times each year – for hours on end – those same wind farms collectively produce less than 5% of their installed capacity (see our post here). At the abstract level, that means that 70,000 homes (5% of 1.4 million) could be “powered” by output from wind farms. But that’s not what the myth says.
From the data seen above, there are long periods when actual output struggles to exceed more than 4% of total installed capacity, which completely demolishes Myth #2.
Verdict: Myth #2 – BUSTED.
Myth #3: “wind power is a substitute for fossil fuel generation sources”.
The data above kills this myth stone dead. Intermittent and unpredictable wind power output means that wind power is not – and can never be – a substitute for on-demand generation sources, which obviously includes gas and coal generators.
There are hundreds of occasions each year – like those seen in our data above – when, for hours on end – total wind farm output is less than 10% of installed capacity (or half that and less), but the power that householders and businesses need simply has to come from somewhere.
The alternative, of course, is for households to break out the candles and eat cold tins of baked beans while they wait for the wind to pick up. Some might see a wind power “blackout” as a good opportunity to defrost the deep freeze and everything in it. But every other day?
Widespread blackouts are relatively rare occurrences where a grid relies upon base-load gas and coal plants, with sufficient intermediate (on-demand) generating capacity to meet spikes in demand. A grid trying to rely upon wind power would collapse into chaos within 24 hours.
And it wouldn’t matter if there were 100,000 giant fans connected to the Eastern Grid – the result would be identical. As soon as the wind stops blowing, output plummets and – in the absence of coal and gas powered plants – every home and business would be plunged into silent darkness.
The critical point – as the actual output data shows – is that wind power is not available “on-demand”; and never will be. It will never be a substitute for “on-demand” power sources, which – at the present time – in Australia means gas, coal and hydro power.
Verdict: Myth #3 – BUSTED.


The BOM has stated that a massive unmoving ‘High’ is currently effecting our continent and is likely to remain in place all week (there certainly hasn’t been a breath of wind where I live). I look forward to an STT ‘expose’ of the amount of wind powered generation for this week!!
…… The average punters don’t have a clue about what is happening and fall too easily for the con tricks of this corrupt industry. An example of the ignorance ‘out there’,… a little old lady said of the Penshurst IWEF proposal, “I think it’s wonderful as we will be getting free electricity” – it is beyond belief isn’t it?
This (in the) ‘red’ energy providers, definitely not green, after raking in money for not powering our homes and upping prices through bad practices then have the gall to totally rely on and use conventional coal or gas fired energy to keep them running. Who foots the wind energy producer power bill?..us! Who foots the agony of destroyed landscapes, ruined neighborhoods and health impacts?…us.
Well and truly time to ditch the green tinted glasses and set an example for a world that’s constipated and overloaded by an energy system that repeatedly won’t work. It destroys conventional energy systems that don’t cope with the fluctuating supply that gets dumped into the ground when it’s too windy.
Power lines being installed from SA to Vic supposedly to provide an upgraded system for better power provision i.e. when power drops half-way around south-eastern Australia…are a hook-up for more REC’s and money to wind energy producers.
Unless something is productively changed by the RET’s review, we may see electricity rationed to homes while the wind is blowing at night. We’ll be learning to live with third world conditions with a system that can’t work.
Cynicism may stop when wind facilities start being penalised, shut down and removed for breaches of already permissive permit conditions and for torturous noise abuses that ‘social licence to operate’ destroys; the simple right to a good night sleep in our own homes.
If any one of your readers needs confirmation that the Clean Energy Council is little more than a bunch of “paid spruikers”, notwithstanding their official-sounding name, they should check out the web site. On their Policy and Advocacy page is the startling exhortation to potential new members to sign up and “STAY AHEAD OF THE GAME”. Says it all!
One thing that the wind weasel and greentard goons have tried very hard to do is turn lies into truth, but they have failed.
STT you have well and truly busted the Myth (falsehood, fiction, illusion, invention, fabrication, untruth), simply by examining the graphs created from AEMO’s own data.
You have presented the Truth (reality, fact, genuineness, exactness, veracity) of this industry.
There is no hiding from it, they will try but they will fail because the ruckus they constantly make is causing people to look more deeply into the industry, and that’s the last thing they want.
But its too late, people are now realising the evidence is staring them in the face – the dust storm from the intermittent turning turbines is clearing and the ‘rose’ coloured glasses are being set aside for ones with clear polarised lenses.
I recall that as a lawyer acting for the ‘defence’ being admonished by the presiding magistrate as follows – ‘a fraud is a fraud Mr. Conn regardless of what spin you put on your client’s behalf’. The details outlined by STT in this post give truth to that remark that I never imagined possible as a young defence lawyer. One can only hope that our current federal government has the perspicacity that that ‘old’ magistrate had and call the ‘wind industry’ for what it really is, that is, a fraud. A fraud of gigantic proportions! Exactly how much ‘proof’ do you have to have before the penny drops? We are all indebted to STT for the compilation of facts on this post.
Could it be that all this FRAUD has been created to generate money from electricity bill payers? Pardon me for being cynical…but given that the cost of power has increased in excess of 100%, when the fraud stops tonight, will the electricity prices be reduced 50%?