
Pin your energy needs on the weather, and prepare for disappointment, over and over and over again.
South Australians know it, Germans know it, Texans and Californians know it, all too well.
In the latter part of 2021, as the Big Calm descended across Western Europe, Brits learned all about it, too. Quietly firing up once-mothballed, but ever-reliable, coal-fired power plants and feverishly importing nuclear power from France.
All up, the ‘inevitable transition’ to an all wind and sun-powered future has amounted to little more than a well-orchestrated high farce.
On that score, Paul Homewood takes a look at what passes for research into the likelihood of total wind power output collapses in Britain.
While Paul reckons that no one is suggesting the wind will stop blowing completely around the postage stamp of territory that is the UK, we’ll set out a couple from the archives to prove that the wind most certainly stops blowing completely across the entire Eastern half of the continental landmass known as Australia, and, on occasions, for days on end.
But first, here’s Paul.
Power When You Need It? Not With Wind
Not a Lot of People Know That
Paul Homewood
20 December 2021
If this is the standard of research into the reliability of wind power, then heaven help us all:

Nobody is seriously saying that the wind will stop blowing completely around the UK, as they imply. This is just a red herring.
The real issue is that there are long periods, days and even weeks, when wind power is generating at extremely low levels.
It can also be extremely variable on an hour to hour basis, as the summary of the last 48 hours shows below:
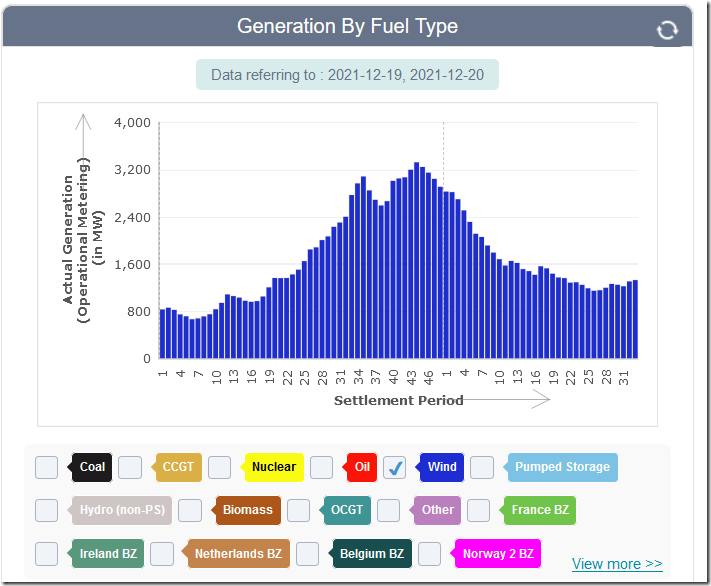
Source: https://www.bmreports.com/bmrs/?q=eds/main
Using the data from GB National Grid Status, so far this year, wind power has been producing at less than 2 GW for 22% of the time. 2 GW works out at about a capacity factor of 10%, which I am sure most normal people would regard as pretty worthless.
It has even been running at below 1 GW for 9% of the year. Average output is over 5 GW.
It is true that low winds tend to be more common in summer, when demand is low. But they can still occur in winter. Between 27th Feb and 4th March, wind power never reached 2.5 GW for 112 hours straight. During this period it was below 2 GW for 99 hours, and averaged just 1.1 GW overall.
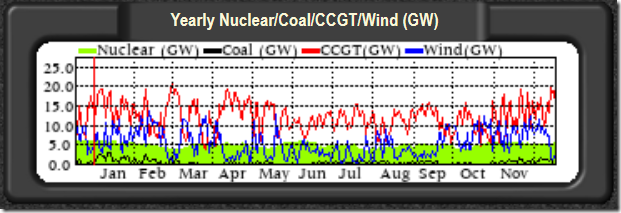
Source: http://gridwatch.templar.co.uk/
It does not matter how much wind capacity you have. Nought percent of anything is still nothing.
Not a Lot of People Know That
Total Joke: Australian Wind Farms Regularly Deliver Tiny Fraction of Their Total Capacity
Stop These Things
May 12, 2021
If Australia’s wind turbine fleet hadn’t cost power consumers $20 billion to build, the joke would almost be funny.
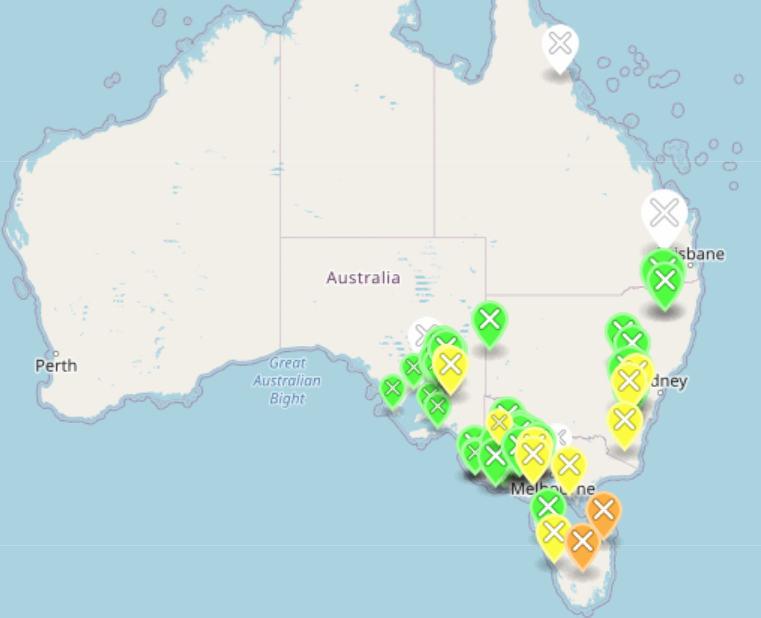
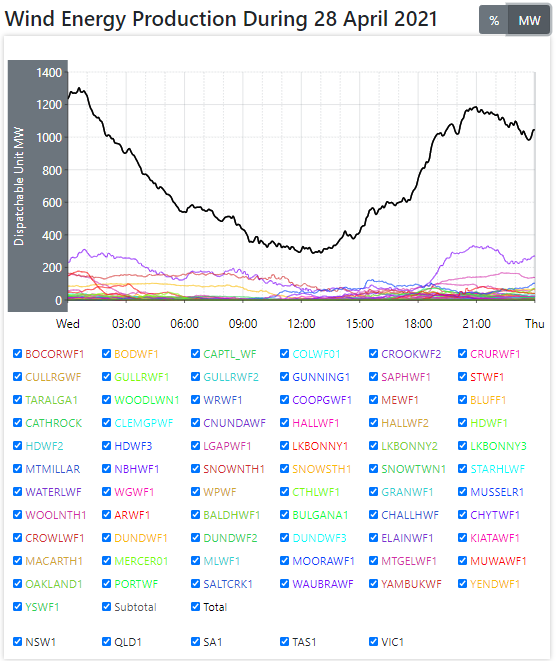
Spread from Far North Queensland to the West Coast of South Australia, on the Eastern Grid, Australia’s wind farms are located in 5 States: Tasmania, South Australia, Victoria, NSW and Queensland (see below).
In SA they’re spread from Port Augusta in the North, west to Cathedral Rocks on lower Eyre Peninsula and south to Millicent in the South-East.
In Tasmania, Cape Portland (Musselroe) and Woolnorth (Cape Grim) are situated on its northern coastline.
There are turbines spread all over Victoria, from West to East.
In NSW, they’re spread from Broken Hill in the far west, all over its tablelands and right up to Glen Innes in the New England Ranges.
In Queensland you’ll find them at Coopers Gap in the South, right up to Mount Emerald on the Atherton Tablelands to the west of Cairns.
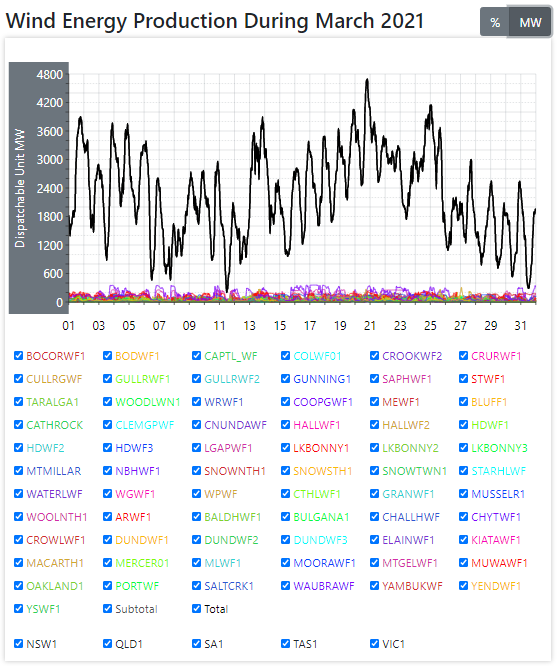
The combined total capacity of all of the wind turbines hooked up to the Eastern Grid is 8,132 MW. And yet, notwithstanding being spread across an enormous geographical expanse, Australia’s whirling wonders often struggle to collectively produce more than 200-300 MW, representing less than 2-3 percent of all that monumentally expensive generating capacity (see above and below).
The sudden and chaotic 2-3,000 MW collapses in output are a grid manager’s nightmare.
Hopeless doesn’t cover it. No wonder Australia’s grid is on the very brink of collapse.
Here’s the teams from Catallaxy Files and Jo Nova taking a look at just one occasion when Australia’s wind ‘industry’ was proving itself to be anything but.
Dramatic falls in the output of wind power
Catallaxy Files
Tony from Oz
24 April 2021
It was known from the start that wind inputs power inputs to the grid would be intermittent but there was an expectation that the supply would become more even as more capacity was built
In 2012, when the installed capacity was 2GW, Paul Miskelly published the first major analysis of the system and he warned that the problem of wind droughts and rapid fluctuations in the wind supply might not be mitigated in the course of time. The reason is that high pressure systems cause the lows and they can sit across the whole of the SE for many hours and sometimes days.
John Morgan’s study in 2015 with 4GW of installed capacity supported Miskelly’s findings.
Mike O’Ceirin studied all the low-wind periods from 2011 to 2020 and found that prolonged wind droughts across the whole of SE Australia (the National Electricity Market) persisted with 8GW of installed capacity. Outage YYYY V2 (1)
The spreadsheets indicate the periods when the output was 10% or less of the installed capacity. They show the duration of the low wind periods (33 hours max in 2020) and the the average supply during the period (6% in that case). The data cover the years 2011 to 2020.
Recently “Tony from Oz”, a long-term wind-watcher and commentator released some detailed studies of fluctuations in the wind supply.
The most important observation
Over the relatively two years of the study, significant falls in the supply of wind power, equivalent to the size of a typical coal-fired generator, became more prevalent, larger in size and the power loss occurred more quickly.
Frequent outages of coal-fired turbines would be regarded as a serious scandal and receive headline treatment in the media. Similar falls in the wind system pass without comment.
Supporting Information
The data come from the continuous record of output from all the registered generators that is kept by the Australian Energy Market Operator. Each wind farm is registered as a generator, likewise the individual generators, often four in number, in coal-fired power stations.
The observations cover 800 days from May 2018 to the end of June 2020
The number of short-term falls of 500MW or more were counted in periods of one hour or less and in one to three hours. A separate report covered larger falls over longer periods.
The 500MW figure corresponds to the most common capacity of coal-fired generators, so the fall of 500MW can be compared with the impact of a coal-fired generator going off line.
The situation got worse rather that better over the period of analysis, contra to the hopes and expectations of the industry.
People with a professional interest or some other motivation to get into the details of the studies can find them in The Introduction, the Study of Short-term Falls and Long-term Falls.
More on wind drought, a couple of my papers Australian Energy on the Brink on Watts Up With That and No Gusts No Glory, from Quadrant On Line.
Catallaxy Files
Wednesday’s mass failure of $20 billion worth of Wind power in Australia
Jo Nova Blog
Jo Nova
30 April 2021
What grows on a wind “farm”? Debt-cows
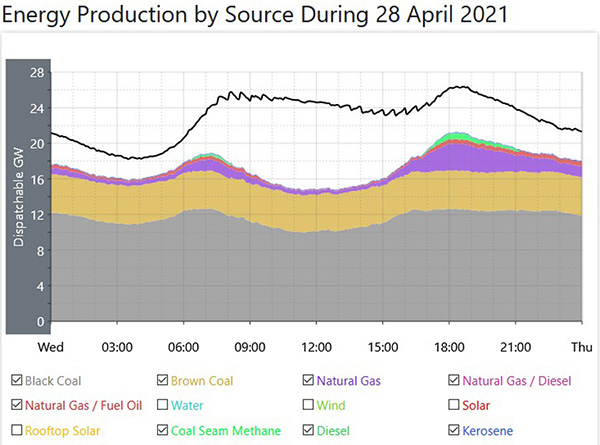
On Wednesday nearly all the wind generators in the country failed. About 4,000 turbines across five states of Australia were hit by some kind of simultaneous fuel crisis. At one point all the wind power in our national grid was only making 3% of Australia’s electricity, and that was the best part of the day. At its worst, all those turbines produced about 1.2% of the power we needed. It was that bad.
Across the nation, something like $15 to $20 billion dollars of infrastructure ground to a halt.
Welcome to the clean green energy future:
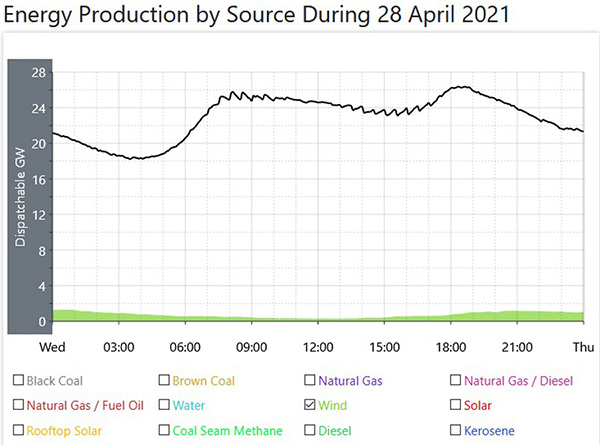
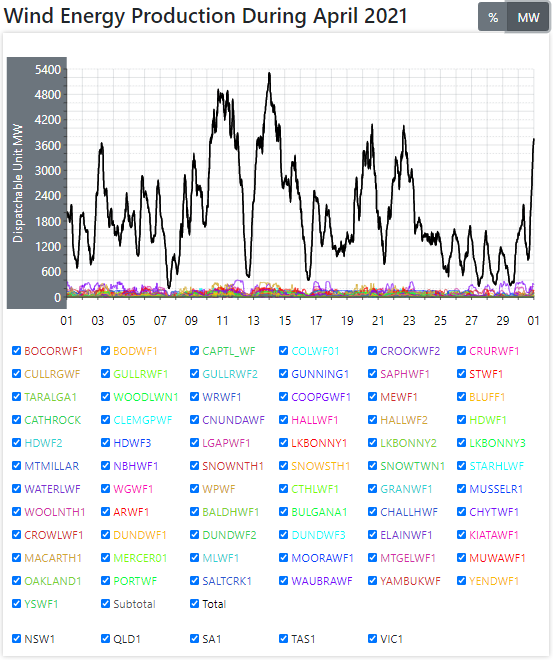
Wind farm total production April 28th Australia.
The black line in this image is the total power generation across the day, and that equates equally to power consumption across the day. The green colour rolling along the bottom is wind generation, all of it, across the day. Who pays for the battery back up for these dysfunctional non-farms?
As Rafe Champion would say — it was a “choke point” all day.
It would be nice to believe this incident was due to all the old failing wind towers that used to be reliable workhorses. If only. Then there would be hope we could fix things. But these were mostly new towers, and this is as good as it gets.
We could double the money and build Snowy 2.0 power storage, state interconnectors, and batteries. Otherwise we just have to pay off the Sun, the Moon and the Southern Oscillation.
Or, of course, we could back up 99% of the entire grid with fossil fuels (and some Hydro), which we do. But then the wind farms are completely superfluous, except to make the Greens feel good, and the Renewables Industry rich.
TonyfromOz estimates we get a day like this once a year, but there are a lot of 6-hour-type squeezes when all 4,000 plus turbines make even less. A battery just isn’t going to cover that…
Who pays for the back up? We the People.
As TonyfromOz says: compare the productivity of a 50 year old coal plant
Let’s look at the ancient old clunker Liddell, now coughing its last, after 50 years of operation. Only two of its four Units are in operation, and both of them are operating at much reduced Capacity. Liddell delivered more power across the day than did EVERY wind plant in the Country, in fact nine percent more power across the whole 24 hour recording period.
So, on this day, every single wind plant in Australia cannot match the delivery from HALF of the oldest coal fired plant in the Country.
We’ve spent something in the order of $20 Billion dollars to get an 8GW generator that doesn’t work most of the time. Liddell, if they fixed it, and it could run in a free and fair market, would still be profitable.
BTW — The graphs come from Anero.id, a site set up by one man — Andrew Miskelly — that provides an essential service our well funded AEMO and the entire Ministry of Energy and Infrastructure can’t manage to provide. Amazing what one determined bright guy can do.
For more information see TonyfromOz: Daily power for Tuesday 28th April: All day wind power was generating between 1 and 3% of the total Grid requirements.
References and estimates below
The rough cost and size of the Australian Wind fleet
On paper there is 8,100MW of theoretical Wind power on the National Energy Market in Australia.
(Once, for five minutes, all the turbines produced 5,310MW).
The largest installation in Victoria — The MacArthur wind “farm” — cost more than $1b in for supposedly a 420MW plant which works like a 100MW generator except for all the times it doesn’t. At that rate, the cost of building all the wind plants in Australia works out at around $19b.
The largest plant in Australia is the Coopers Gap Wind Plant, and its cost was $850 Million for a 452MW plant. With this new bulk savings the total build in Australia for 8GW of wind would be about $16b. But we probably spent a lot more.
The average wind tower is 1.95MW, so there must be around 4,200 wind towers in Australia in to add up to 8.1GW in total Nameplate capacity.
The current Capacity Factor of wind power in Australia is about 29.5% according to Tony. It’s as if it was a 2400 MW really unreliable generator.
Jo Nova Blog
Australia’s Failed Wind Power ‘Experiment’ Makes it an International Joke: Wind Power Output Totally Collapses (Again)
Stop These Things
May 14, 2017

Where the wind industry’s propaganda machine has spent the best part of 20 years trying to reinvent the facts, giving perceived substance to myth and fantasy – what American comedian Stephen Colbert defines as “truthiness”, assertions emanating ‘from the gut’ which are made because they just ‘feel right’ – STT has spent its entire existence setting those facts straight and lifting the lid on a raft of others that the wind industry works overtime to avoid.
The big problem for wind power is, and will always be, the W-I-N-D.
Sailors know it. Kite flyers know it. But, for some strange reason, the wind cult simply cannot come to grips with it.
Australia’s Eastern States, with the exception of Queensland, have thrown billions in subsidies at the construction of a couple of thousand of these things; the embattled economic backwater, South Australia led the charge – and earned the (now infamous) tagline ‘Australia’s wind power capital’.
After South Australia’s coal-fired power plant closed in May last year, it also earned the ignominy deserving of a state that simply cannot keep its lights on and which suffers power prices amongst the highest in the world – right up there with wind ‘powered’ Denmark and Germany. [note the prices quoted below are in US dollars]
SA’s power pricing and supply calamity is now world news.
Here’s The Daily Caller’s Andrew Follett helping to place Australia’s energy debacle on the world stage, as a warning to all comers: unless you are prepared to destroy your once reliable and affordable power supplies, don’t follow South Australia’s disastrous lead.
Wind Farms In Australian State Generate ZERO Energy
The Daily Caller
Andrew Follett
9 May 2017
An Australian state heavily reliant on wind power for its electricity needs generated literally no energy from turbines Tuesday, according to government data.
South Australia generated an average of 35 percent of its energy needs using wind turbines in 2015, but wind turbines provided zero megawatts of power Tuesday afternoon.
South Australia’s reliance on wind power has been a point of contention. An October report from the Australian Energy Market Operator blamed a massive blackout in September on a wind farm that suddenly stopped providing power, destabilizing the grid.
Liberal Party Sen. Chris Back formally called for a moratorium on new turbines after the blackout so the government could do a cost-benefit analysis of wind power. Back said over-reliance on wind turbines drove up electricity prices and posed serious blackout risks in South Australia.
“There should be no further subsidies paid for an intermittent and unreliable power source that can be seen as a proven failure. There are solutions to our climate challenges but wind power is not one of them,” Back told The Australian.
South Australian electricity prices rose to 200 cents per kilowatt-hour during the blackout power crisis. The average Australian currently pays about 25 cents per kilowatt-hour of electricity, according to research by the country’s parliament (view PDF).
South Australia plans to invest another $100 million into green energy.
Daily Caller

***
Where international florists, Inter-Flora liked to ‘say it with flowers’, STT likes to ‘say it with pictures’. And here are a few, courtesy of the boys over at Aneroid Energy: the one-stop-shop for those keen to bust the ‘wind-is-always-blowing somewhere’ myth.
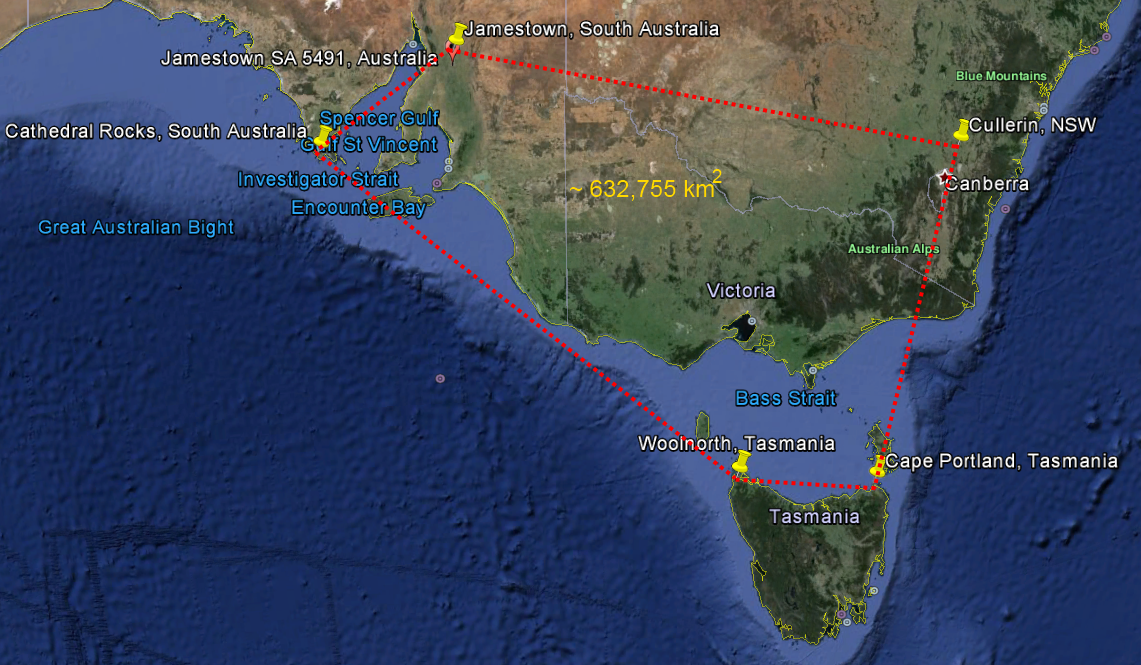
As depicted below, on the Eastern Grid Australia’s 45 wind farms are located in 4 States – Tasmania, South Australia, Victoria and NSW – and spread from: Jamestown in the Mid-North, west to Cathedral Rocks on lower Eyre Peninsula and south to Millicent in South Australia; down to Cape Portland (Musselroe) and Woolnorth (Cape Grim) in Tasmania; all over Victoria; and right up to Cullerin on the New South Wales Tablelands.
Those wind farms are spread out over a geographical expanse of 632,755 km². That’s an area which is 2.75 times the combined area of England (130,395 km²) Scotland (78,387 km²) and Wales (20,761 km²) of 229,543 km².
The total notional capacity connected to the Eastern Grid is 4,395MW, with 1,698MW in Victoria (population 5.8 million), 1,726 in South Australia (population 1.6 million) and the rest in NSW and Tasmania. So let’s have a look and see how the whole fleet has been faring in May:
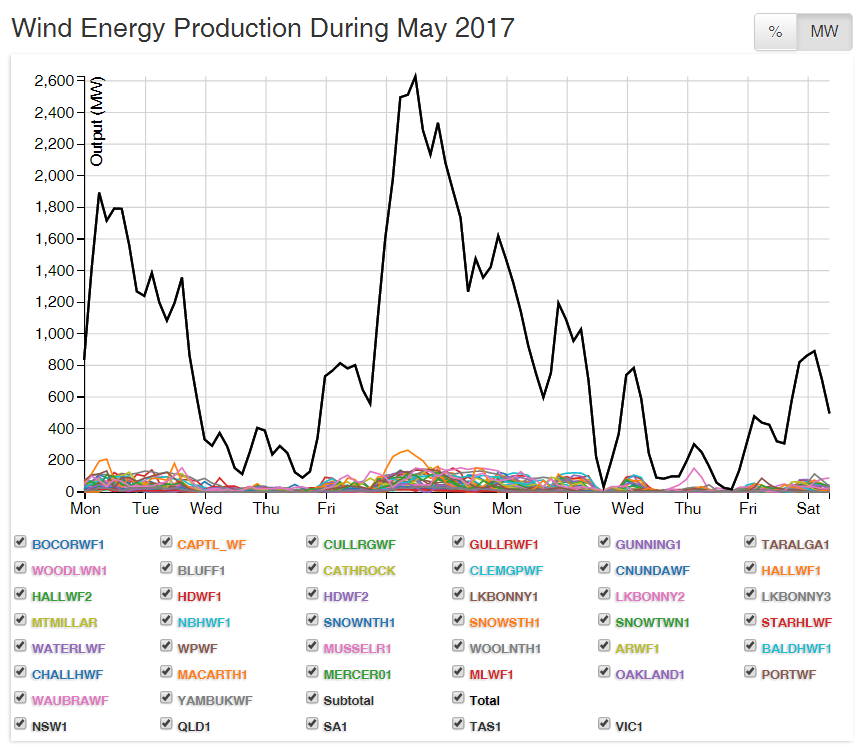
Hmmm… No, that’s not a minimalist impression of Mt Everest, that’s the entire output of Australia’s 50 wind farms spread over the South-Eastern corner of the Continent for the first 2 weeks of May.
Let’s drill down and see how Jay Weatherill’s team was helping to put the results of his wind power obsession on the map:

When some wind cultist starts telling you about how SA gets 40% of its power from the wind, pop the graph above in front of them and ask, ‘when?’
Most of the time SA’s wind farms are producing ZERO% or a level so close to zero that what’s being produced is simply an annoyance to the grid manager trying to keep the thing from collapsing.
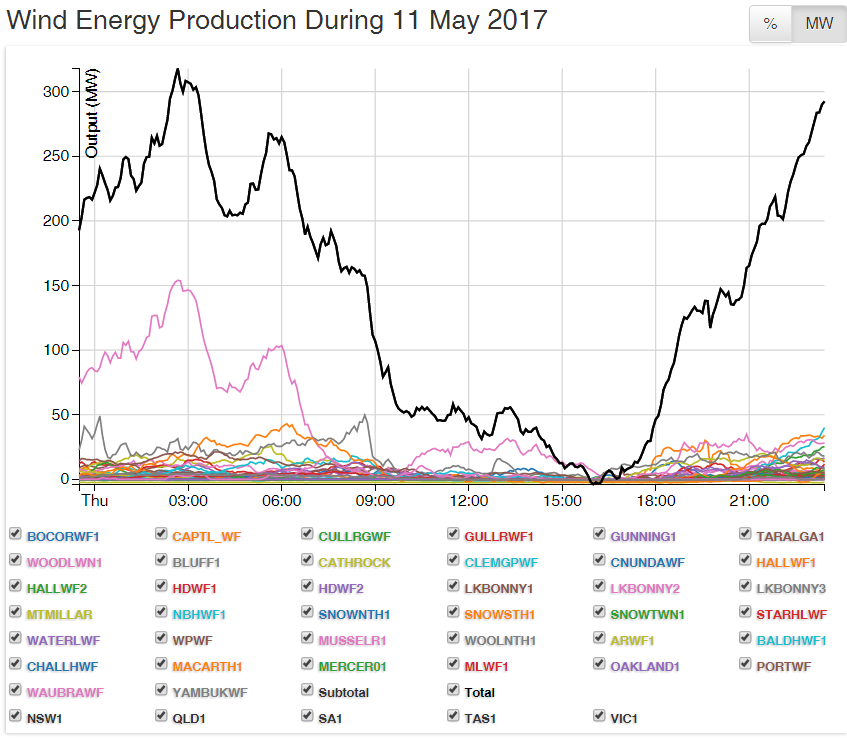
Let’s take in the period referred to in Andrew Follett’s piece, Tuesday, 9 May and the days following with daily wind power output across the entire Eastern Grid:

Bear in mind that what appears above and below is the combined the effort of machinery alleged to be capable of producing 4,395MW – after lunch on Tuesday, all that that massively subsidised mess could manage was a risible 10MW. And the following day wasn’t anything to write home about, either:

Having collapsed by a grid-killing 400MW in the space of an hour or so (Australians should thank their lucky stars for those dreaded coal-fired plant still chugging away in Victoria and NSW), the ‘team’ struggled to hold the line at 100 MW for most of the day: that paltry performance amounts to 2% of the combined capacity of 4,395MW.
And, on Thursday, the effort was even more pathetic (note the scale on the vertical axis collapses), with the entire collection of the Eastern Grid’s whirling wonders only briefly topping 300MW (less than 6% of capacity) at either end of the day, with demand at its lowest; for the bulk of the day less than 50MW (or less than 1% of capacity); and sinking below zero at 4pm, with wind turbines in their hundreds literally sucking power out of the grid to keep their onboard systems (cooling fans, yaw control, hydraulic pumps, brakes etc) working, due to the absence of so much as a breath of wind across the entire South-East of the Continent.
Anyone engaged in pushing the ‘truthiness’ of wind being able to ‘power’ Australia (or anywhere else for that matter) is in desperate need of professional care and/or medication: but the cultists are not just delusional, they’re certifiably dangerous.
Any sailor could have pointed out just how fickle the wind can be and the risks attached to attempting to rely on it to get anywhere, anytime soon.
If your country has yet to launch into the lunacy of wind power, take a leaf out of the Australian’s book and don’t.


I ran a group here in Iowa called The Coalition for Rural Property Rights for about four years. It is about impossible to stop wind turbines in Iowa because our entire GOP (starting with Chuck Grassley!) supports Green New Deal initiatives.
It took me a long time to figure out what the bottom line is and it has to do with the Global Cabal and depopulation. Go to Bitchute or Rumble and watch the video series The Fall of the Cabal. Most people who are reading this have already chosen the Red Pill. If you are interested in rabbit holes and full disclosure do watch the full series but you will not be able to un-see it and it will change your entire view of our world. Wind turbines are only on the tip of the iceberg.
I am still fighting but in a new way. I write for The Iowa Standard, Iowa’s only real “free” newspaper.
Keep at it Janna, every mind you open to the wind power fraud counts as a victory for common sense and reason.