
Adelaide, South Australia, 28 September 2016.
***
South Australia’s obsession with wind power has brought with it a grab bag of calamitous results – including retail power prices more than double the cheapest state in Australia, Victoria and its globally ‘acclaimed’ habit of “Australia’s wind power capital”: routine load shedding and statewide blackouts. The most notorious of which occurred on 28 September this year, when winds hit gale force across the northern part state, where wind turbines were automatically shut down to prevent catastrophic failure: ‘GUILTY’: South Australia’s Statewide Blackout Caused by Deliberate Wind Farm Shutdown
That debacle has rendered South Australia an international laughing stock. However, in one clear sense, it is a ‘world leader’ in demonstrating how intellectual pygmies driven by cultish-ideology can destroy once reliable and affordable power supplies in a heartbeat; destroying whole industries and regional economies in the bargain.
Now those Europeans states which, like South Australia, threw everything to the wind, are about to reap the folly of what they have sown.
The European Blackout Risk
Energy Matters
Roger Andrews
24 November 2016
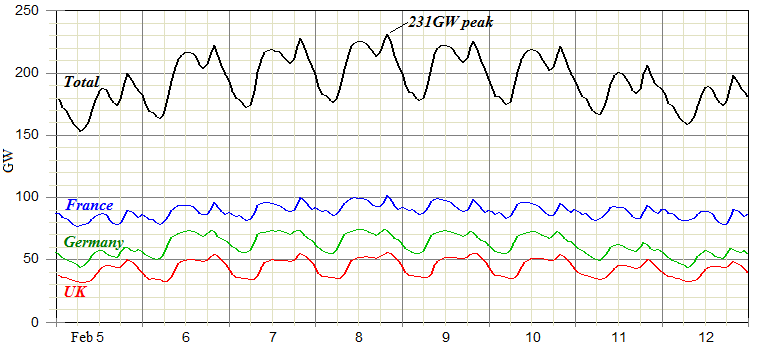
At 2000 hours Central European Time on February 8, 2012 combined electricity demand in the UK, France and Germany peaked at a high of 231GW during a winter cold snap. This caused no serious problems at the time, but the UK, France and Germany could have a combined total of as little as 210GW of capacity on-line this winter, and if another 231GW demand peak coincides with 210GW of available capacity the alternatives will be either large-scale “demand side” management (i.e. paying lots of industries and businesses to shut down) or blackouts.
In this post we will look at how these conclusions were arrived at and also at some of the uncertainties that make it so hard to predict blackout risks. The chief uncertainties in this case are a) how cold might it get, b) will the wind be blowing when and if it does get cold, c) how much of the French nuclear fleet will be down for inspection at the time and d) how many French households will turn their electric heaters up to “high”, as many of them did in 2012.
The 2012 Demand Peak:
The February 8, 2012 demand peak is used as the base-case (although it’s probably a worst-case) demand scenario in this post. Figure 1 plots electricity demand in the UK, France and Germany and the sum of the three from February 5 through February 12, 2012. The data used are hourly readings from the P-F. Bach data set:
***
The three demand curves have very similar shapes and peak within an hour of each other. French demand was, however, about twice as high as UK demand and about 50% higher than German demand, with the reason being that French homes are heated by electricity rather than gas and the French like to stay warm. As shown in Figure 2, electric heating came close to doubling French demand at the height of the February 2012 cold snap:

***
CURRENT INSTALLED CAPACITY ESTIMATES:
The best estimates of current installed capacity I have been able to come up with are summarized in Table 1. There are some uncertainties related to these estimates because different sources sometimes disagree as to what the current installed capacity is. There are also some questions as to exactly what category a particular generation source fits into. (Trying to reconcile the entries in Table 5.6 of the latest BEIS summary, which contains three separate tables and ten explanatory footnotes, was particularly challenging – so challenging in fact that I decided not to use them.)
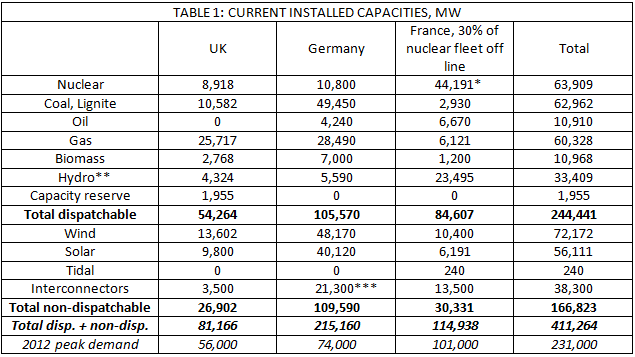
* Total installed nuclear capacity is 63,130MW
** Sum of conventional + run-of-river + pumped
** * 2012 estimate
Data sources for Table 1 were:
- Germany: the Fraunhofer Institute
- France: Conventional generation from French grid operator RTE , solar data from PV tech , wind data from the European Wind Energy Association and biomass from Eurelectric
- UK: DUKES 2016 as compiled by Euan Mearns in this earlier post.
Capacity is segregated into dispatchable and non-dispatchable categories. Dispatchable power is sent to the grid when the grid needs it. Non-dispatchable power is sent to the grid when the wind blows or the sun shines or the tide flows whether the grid needs it or not.
Interconnector capacity is provisionally classified as non-dispatchable because there won’t be enough of it to go round if there is a 231GW demand peak this winter. Germany will have a substantial surplus, but because of limited interconnector capacity it won’t be able to export enough power to France and UK to make any significant difference to their power deficits, as discussed later in the section on Derated Capacity.
The “Capacity reserve” includes idled power plants and other generation sources such as diesel peakers that have been contracted to supply emergency power during high-demand periods when on-grid resources can’t generate enough power to meet load.
A “capacity market” is already in place in the UK. France has recently enacted capacity market legislation and but so far as I know has yet to contract any capacity. Germany has passed enabling legislation for a future “power market”, which is supposed to be different to a capacity market but which appears to amount to the same thing. (Capacity markets are a good indicator of how vulnerable a country’s grid is. The UK enacted one when it became clear that fossil fuel and nuclear plant closures had left the country with an inadequate reserve margin.
France recently concluded “that without the capacity mechanism the uninterrupted supply of electricity could no longer be guaranteed if France faced extreme winter conditions”. Germany has no immediate reserve margin problems (except in Southern Germany, as discussed later) but foresees, correctly, that it will have when it begins to phase out its lignite and nuclear plants. Germany’s plan in fact contemplates that the phased-out lignite plants will be transferred to an “emergency reserve” that will “ensure efficient power station operation at a time when more and more renewables are entering the electricity market, and to ensure security of supply.”)
When both dispatchable and non-dispatchable generation are summed total capacity handily exceeds February 2012 peak demand in the UK and France and exceeds it by a factor of almost three in Germany. But only Germany has enough dispatchable capacity to cover the 231GW 2012 peak demand, were it to recur this winter. The UK would need a ~2MW contribution from intermittent wind and solar to see it through and France would need a ~15MW contribution – always provided that all the available dispatchable capacity is generating at 100% at the time. Which brings us to the question of “derated” capacity.
DERATING FACTORS:
Dispatchable generation:
A plant that generates dispatchable power can deliver it to the grid as and when required provided it’s not down for scheduled maintenance or because of an unscheduled outage. Consequently we have to make an estimate of the percentage of the time the plant will be in service and “derate” its capacity accordingly.
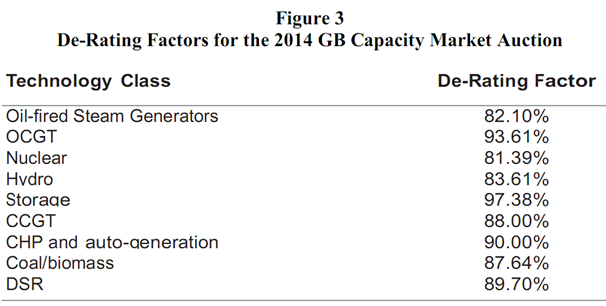
The derating factors the UK National Grid applied to dispatchable generation sources in 2014 are in the low 80% to low 90% range (Figure 3). The two-decimal-place precision is, however, going a little far, and the 81.39% derating factor for nuclear seems a little harsh. After consideration I concluded that the 85% across-the-board factor Euan Mearns used in the post linked to earlier was as realistic as anything, so I used it too.
***
Intermittent generation – solar:
This is an easy one. Winter peak load in the UK, Germany and France occurs after the sun has set. The derating factor for solar capacity is therefore zero.
Intermittent generation – wind:
Since the wind can blow at any time at any strength a probabilistic approach is needed to establish a derating factor. A detailed loss-of-load expectation assessment would have taken too long, so I used the following relatively crude approach:
- Download the P-F Bach hourly wind and load data for the UK, Germany and France for the three winter months (December, January, February) in the years 2011 to 2015.
- Extract wind generation data at the time of daily peak demand (yielding 450 individual numbers).
- Convert wind generation to a percent capacity factor by dividing it by installed wind capacity in the relevant year using installed capacity data from Wikipedia.
- Order the capacity factors at peak demand from low to high and plot them against the percentage of readings.
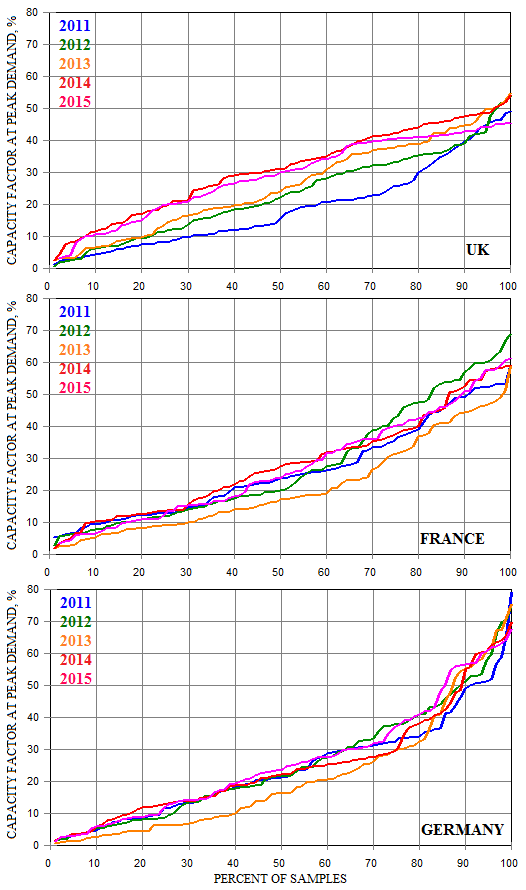
An example of output is provided in Figure 4, which plots wind capacity factors at peak demand for the UK, France and Germany by year:
***
Figure 4 shows a few curious features, such as the anomalously low UK capacity factors in 2011. These are likely a result of inaccuracies in the installed wind capacity estimates. As shown on Table 2 the overall results are reasonable:
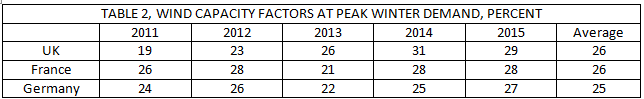
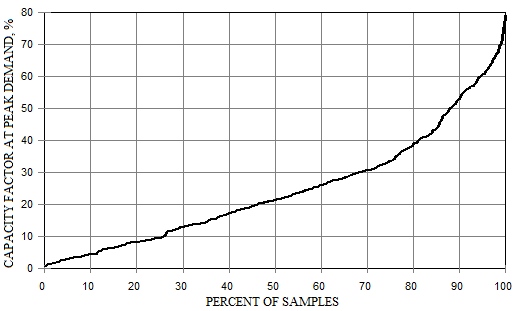
Combining the results for all three countries and all five years of observations yields the plot shown in Figure 5.
***
The question of how to convert this plot into a derating factor now arises. Figure 5 tells us, for example, that wind delivers power at a capacity factor of 22% or more for half the time, but we are clearly going to need a probability of better than 50-50 when the security of the nation’s electricity supply is at stake. But how much better? In the absence of an obvious answer I chose 85%, the percentage by which dispatchable capacity is derated.
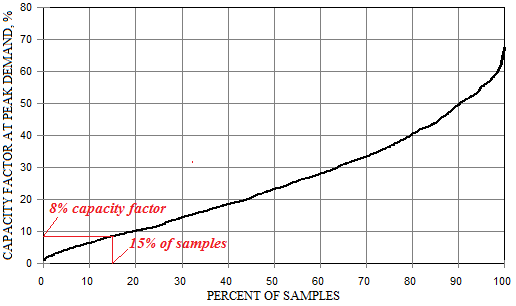
As shown in Figure 6 the 15% ordinate on Figure 5, above which 85% of the data occurs, corresponds to a capacity factor of 8%. Accordingly I have used 8% as the derating factor for wind in all three countries.
***
Interconnectors:
Interconnectors flows are not assigned a derating factor but are distributed between Germany, France and the UK as discussed below.
DERATED INSTALLED CAPACITIES:
We are now in a position to apply derating factors to the installed capacity numbers listed in Table 1. The results are shown in Table 3:
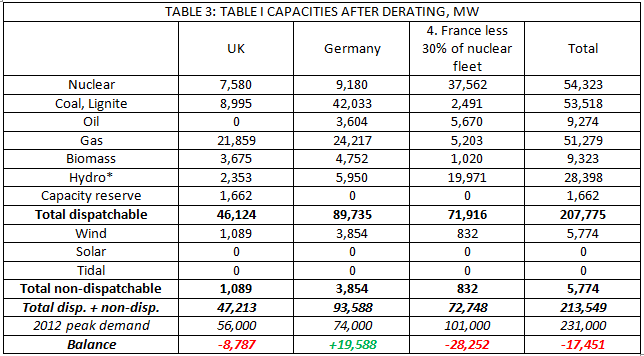
After capacities are derated Germany has a generation surplus of 19.6GW relative to 2012 peak demand while the UK has an 8.8GW deficit and France a massive 28.3GW deficit.
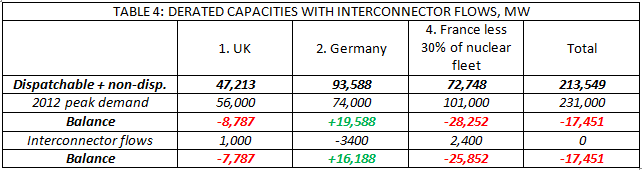
Table 3 does not include interconnector flows, but including them makes no significant difference (Table 4). Germany can export only 2,400 MW to France through the France-Germany interconnector because that’s all the interconnector can handle, and it can wheel only 1,000MW to UK through the UK-Netherlands BritNed interconnector for the same reason. As shown in Table 4 this leaves France, and to a lesser extent the UK, still deep in the red:
SO WILL THE LIGHTS GO OUT SOMEWHERE THIS WINTER?
It’s impossible to say. The first requirement would be an unusually cold winter, and the way the polar jet stream is beginning to gyrate it’s possible Europe will have one. On the other hand it’s possible Europe will have an unusually mild one depending on where the jet stream finally decides to park itself.
The second requirement is a coincidence of unusually cold weather with light winds, which sometimes happens and sometimes does not. Third, a significant fraction of the French nuclear fleet would have to be out of service, which it may or may not be when the cold weather hits – if it does. And fourth, if cold weather does hit then French families and businesses must adjust their electric heater thermostats upwards with the same gay abandon as they exhibited in February 2012.
Another wild card is demand side response, which at the moment consists of governments paying industries and businesses to shut down during potential power shortfalls. I haven’t figured DSR into the equation here, but it could make a difference. Getting paid to shut down when the alternative is to be shut down by a blackout without getting paid anything is an attractive business proposition.
Another question is whether surrounding countries could ride to the rescue. A quantitative assessment is not possible without detailed information on winter interconnector flows, but annual interconnector flows suggest that a cessation of exports from France and Germany could spell disaster for much of the rest of Europe.
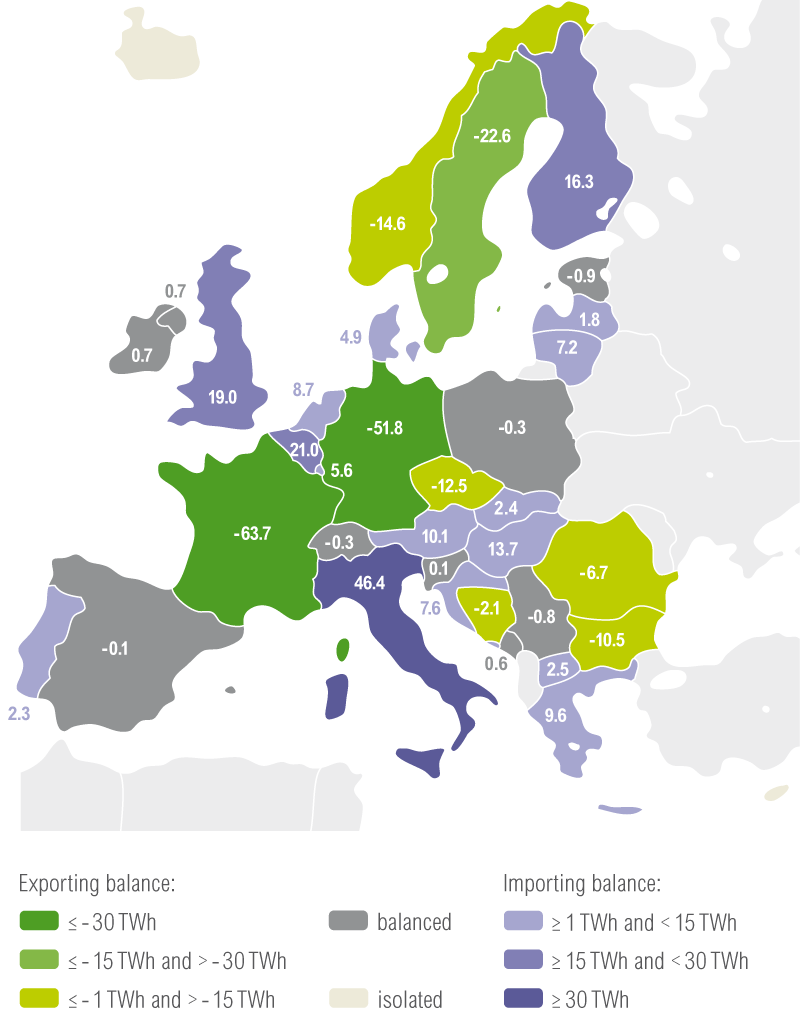
Figure 7, reproduced from the European Network of Transmission System Operators for Electricity (ENTSO-E) shows how Germany and France, with combined net exports of 116TWh in 2015 – about equal to the annual electricity consumption of the Netherlands – dominate the European power export market, and how most neighboring countries depend on power imports to meet domestic demand. (Italy, with 46.4 TWh of imports, is particularly import-dependent, as to a lesser extent are Belgium and the UK.
As I noted in this comment on the recent “France’s nuclear crisis” post 3GW of French exports to Italy has become 2GW of Italian exports to France since France’s nuclear plants began to go off line in June):
***
Yet another factor not considered is that Germany is effectively two countries from the energy security standpoint – Northern Germany, which has a power surplus, and Southern Germany, which according to the German Federal Network Agency for Electricity, Gas, Telecommunications, Post, and Railways “can expect a potential negative balance of up to 5,717 MW by 2018”. This negative balance is a result of post-Fukushima nuclear plant shutdowns, further planned plant shutdowns and inadequate transmission links with Northern Germany.
So will the lights go out somewhere this winter? The chances are against it. But if France does black out during severe weather/low wind conditions there could be a ripple effect that causes power outages over a larger area. And if worse comes to worst, which is a possibility that can’t be totally discounted, the question of how long it it would take to black-start much of Western Europe will rear its ugly head.
Energy Matters


There are 2 possible ways this problem could be solved:
1) Go completely off grid with a stand alone inverter, bbattery storage, battery charger and a backup generator.
2) Use a backup generator to power the whole house … or
3) just the grid-connect inverter in the event of a blackout. If you just powered the grid connect inverter, you still would get any electricity after the sun goes down.
Another ‘solution’ is to keep intellectual pygmies and politically motivated idiots away from functioning power grids and let the reliable and affordable systems we have built and enjoyed for a century do their magical stuff.
The current South Australian Government is effectively holding the State to ransom. They could reopen the mothballed coal fired power station and the State could regain a spine. But instead they are choosing not to and are in turn forcing the public to put up with repeated blackouts until a solution can be found to back up unreliable renewables, a solution that could take the next 10 years at least to solve.
How dangerous is this? This ideology has gone far enough. Time to stop playing with people’s lives. To state but one example, patients on life support machines were put in mortal danger during the last Statewide blackout. Why can’t the current SA Government get it into their heads. You’ve stuffed up big time. Now admit you got it wrong, eat humble pie, reopen your States main base load power source and move on. The time to close coal fired base load power is when and only when you have a reliable source to replace it. And not before.
And one further point of interest. It was recently stated to me by someone who is off grid that for those who have roof top solar and are connected to the grid through smart meters. Well these very same smart meters could be shutting you out of the grid at times of over supply or when the market dictates it. Is this true? It would certainly seem to raise questions about any investment in rooftop solar whilst connected to the grid.
One for the media to investigate perhaps?
Rooftop solar requires power from the grid to run the system, powering inverters etc. During Black Wednesday and its aftermath rooftop panel owners were bemused that even when the sun was shining they had no power in their homes while the grid remained down, this was the case in regional SA for days.
Hi,
I started a PETITION “SA PREMIER JAY WEATHERILL : Demand the RESIGNATION of the Energy Minister for HIGH POWER PRICES CAUSING SA’s JOBS CRISIS and 15,000 household POWER DISCONNECTIONS, frequent POWER BLACKOUTS and the JULY 2016 POWER CRISIS” and wanted to see if you could help by adding your name.
Our goal is to reach 100 signatures and we need more support.
You can read more and sign the petition here:
https://www.change.org/p/sa-premier-jay-weatherill-demand-the-resignation-of-the-energy-minister-for-high-power-prices-causing-sa-s-jobs-crisis-and-also-15-000-household-power-disconnections-frequent-power-blackouts-and-the-july-2016-power-crisis?recruiter=135406845&utm_source=share_petition&utm_medium=email&utm_campaign=share_email_responsive
Please share this petition with anyone you think may be interested in signing it.
Thankyou for your time.
The UK-France interconnector is damaged, will be running at half capacity this winter.
http://www.powerengineeringint.com/articles/2016/11/capacity-problem-looms-as-main-uk-interconnector-damaged.html
Will the lights go out somewhere this winter in Europe or the UK?
1) The planet is NOT warming
2) Sunspot activity down
3) Planet is cooling
4) Planet is heading into an Ice Age
Sources
Hababullo Abdussamatov head of Russian Science Academy said in 2010 “The next Ice Age begins in 2014”
David Evans of Australia said “The next Ice Age begins in 2017”
Robert Felix ‘Ice Age Now’
Harold Ambler ‘Don’t Sell Your Coat’
On top of this we are entering a Maunder Minimum coupled with a La Nina
I reckon there are to be huge embarrassing problems in the near future. One just has to wonder where all the electrical engineers and scientists were when South Australia and Europe opted for wind power. Some extremely shonky advice has been given. Someone will have to take the blame. Someone will have to pay.
Billions spent on windmills and solar just prior to entering an Ice Age. It ain’t going to be pretty,