Australia’s wind industry has been suffering from the Big Calm – with dozens of occasions over the last month or so when the entire wind fleet’s battled to deliver more than a tiny fraction of its combined capacity.
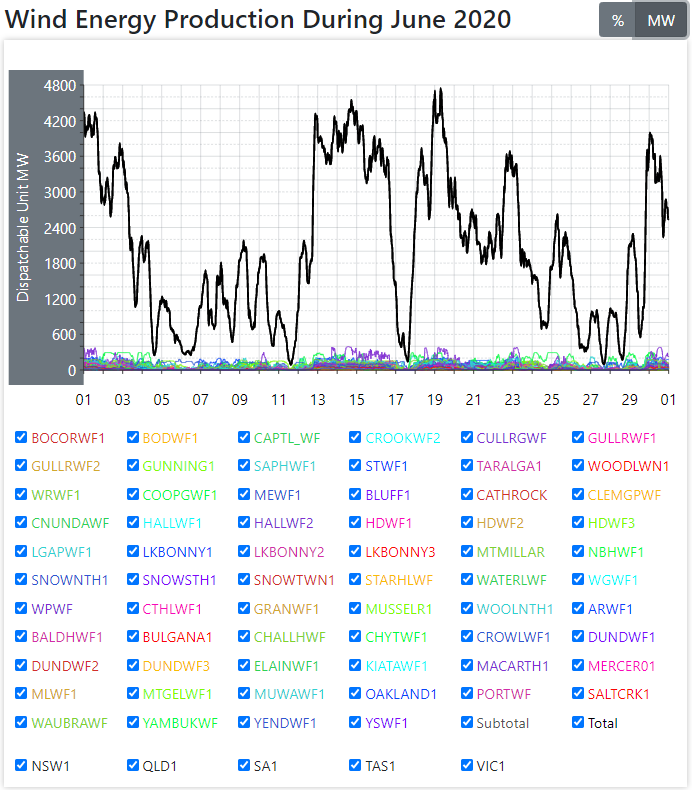
Depicted above – courtesy of Aneroid Energy – is the output delivered by Australian wind power outfits to the Eastern Grid last month.
Spread from Far North Queensland, across the ranges of NSW, all over Victoria, Northern Tasmania and across South Australia its entire capacity routinely delivers just a trickle of its combined notional capacity of 7,728MW.
Collapses of over 3,000 MW or more that occur over the space of a couple of hours are routine, as are rapid surges of equal magnitude, which make the grid manager’s life a living hell, and provide the perfect set up for power market price gouging by the owners of conventional generators, who cash in on the chaos.
During June there were lengthy periods when the combined output of every wind turbine connected to the Eastern Grid struggled to top 400 MW (5.1% of total capacity). Such as: 11 June when output collapsed to a trifling 86 MW (1.1% of total notional capacity); 17 June when total output fell to 134 MW (1.7% of total notional capacity); 26 June when, after a 1,200 MW slide, output was between 300-400 MW (3.8% to 5.1% of total notional capacity); and 27 June when output dropped over 900 MW to bottom out at 96 MW (1.2% of total notional capacity) .
Rafe Champion delves into the consequences of Australia’s most recent Big Calm.
No Gusts, No Glory
Quadrant Online
Rafe Champion
16 July 2020
Imagine a massive irrigation project to make the deserts bloom with a gigantic network of headworks, dams, irrigation channels and pumping stations to encourage farmers to move in and reap a bountiful harvest of food and fibre from a vast expanse of well-watered countryside. The food will be cheaper too! After all, the water and the land are free.
But there’s is a problem. With the burgeoning infrastructure well advanced, very visible and much bally-hooed by an eagerly unquestioning media it turns out that there isn’t enough water much of the time and the freshly planted seedlings die. The people will not starve because food is still being produced from the farmland that was there before the irrigation scheme started. But now that food is costing twice as much.
Tragically this is not a hypothetical scenario because it applies to the Wind Power Project that was launched to achieve the (upwardly mobile) Renewable Energy Target.
Wind Droughts
There are frequent and prolonged “wind droughts” that we can measure using the output from some 70 wind farms and over 2000 turbines across South Eastern Australia, all connected to the grid of the National Energy Market and monitored by the Australian Energy Market Operator.

The chart above shows the percentage of the installed capacity of the system that was delivered hour by hour over the month. The line drawn at 10 per cent indicates the periods when the supply was a tenth or less of the 7.8 Gigawatts of installed capacity.
The low points lasted for 33 hours on the 5th-6th, 18 hours on the 11th, 16 hours on the 17th, 14 hours on the 26th, 11 hours on the 27th and nine hours on the 28th. There were several other lows of shorter duration, giving total of 13 episodes and much of the time during the low spells the supply was well below 10 per cent, with lows of 3.4 per cent, 1.1 per cent and 2.3 per cent during the most prolonged “wind droughts.” All the monthly records are available at https://anero.id/energy/wind-energy
Choke Points
Wind droughts cause “choke points” in the supply of electricity to the grid. Consider the supply of air to our lungs. We need a continuous supply of air and when this is interrupted by choking or drowning we are soon dead. The electricity grid also needs a continuous input of power or it will die, at least in parts.
The reason for talking about choke points is to drive home the fact that the critical indicator of the wind supply that we need to monitor is the low points, not the high points, not the total installed capacity and not the average delivery.
What has happened here?
The “failed irrigation scheme” scenario suggests that ‘someone has blundered‘, as Tennyson famously wrote in The Charge of the Light Brigade. Was information on the frequency and duration of wind droughts available before the government decided to back wind power and RE at large with subsidies and mandates to use power from intermittent sources?
Still, regardless of this discovery, all the Australian states are pressing on with ambitious plans to put more resources into the windpower equivalents of irrigation headworks, dams, channels and pumping stations.
Why in Australia, of all places?
Australia is leading the world in the rush to “clean energy” but this is a serious mistake for two other reasons in addition to the problem of wind droughts. First, Australia is an island. Practically every other industrialized country in the world has neighbours to provide power when wind and solar power are in short supply. European countries can turn to France for nuclear energy, the Scandinavian states for hydro, Poland for coal and Russia for gas. Every kind of power feeds into the North American grid, but in Australia we are on our own.
Second, we have no nuclear power. Isolation would not be such a problem if we had nuclear power.
Please don’t mention batteries and pumped hydro
Elon Musk created a media sensation when he installed a big Tesla battery in South Australia in record time. The big battery has been hailed as a great contribution to the green transition but it is important to realise how small it is compared with the demand of the grid.
It is a remarkable piece of technology, occupying a hectare of space and carrying a price tag of $60 million. It is attached to the Hornsdale No 3 windfarm (100MW rated capacity) and it stores 109 megawat Hours (MWh) of power. That means it can maintain a flow of 100MW from the farm for a little over an hour after the wind stops.
By comparison, the SA grid requires a flow ranging from 1000Mw to 2000MW depending on the time of day. So if the wind stops for an hour the grid needs at least 1000MWh. How far does 109MWh support the grid in that situation?
Pumped Hydro is the other great hope for storage and the showpiece is Snowy 2.0 that is planned to deliver 2000MW of power continuously, matching a large coal-fired power station such as Bayswater in NSW. In the real world this offers no more hope than big batteries. For a start, Snowy 2.0 is not a primary generator because the power that flows from it will come originally from a fleet of solar and wind farms. It is designed to regulate the lumpy RE input and deliver a steady supply. Unfortunately, between 30 per cent and 40 per cent of the original power is lost in the pumping and pipe resistance. The projected cost is enormous, far beyond the original estimate and it may never be built due to the expensive, unforeseen problems in the construction and the damage to the national park.
And if Snowy 2.0 is completed, along with the extra wind turbines to go with it, just 2,000MW of our existing 20,000MW of coal-fired capacity will be replaced. All we need is a few more mountain ranges with reliable rainfall — nine of them, to be precise — to replace the other 18GW of coal power.
In perhaps more urgent need of replacement is a political class as useless as the renewable energy it champions.
Quadrant Online


I recently wrote an article for the latest edition of Transmission and Distribution magazine, where I looked at the Capital Cost of four different 100% renewable energy scenarios for Australia. I wrote the article because I was tired of continuously coming across articles that focused on LCOE prices, which is an incomplete measure of the cost of an electrical grid. Shortly after writing the article, I was referred to the work of Geoff Bongers. Bongers works regularly with Andy Boston, who has created an electrical network modelling tool called MEGS. The following is a link to a presentation gave in 2019 about the application of this model to the NEM. It starts at around the 6 minute mark and goes for about an hour, but I highly recommend you watch it:
Bongers states that there is a phenomenon called Wind Droughts that have an effect on wind energy production. Wind Droughts occur when a high pressure weather system results in little to no wind being blown for a period of time. Bongers analysis found that Wind Droughts in Australia occur about every 5 years and last for about a week. In spite of the size of the Australian, Wind Droughts can spread across the majority of the NEM. The low wind generation periods in early June 2020 verifies this to be the case. Wind Drought are regularly an issue in the UK and European networks, as the wind farms are not spread out as far as in Australia.
Based on the analysis of Bongers, in order to mitigate the effects of a Wind Drought you would need an average of 14 MWh of storage for every installed MW of wind generation. In the article I wrote, my calculations were based on 24 hours worth of storage to cover most weather deficiencies in a renewable network. Based on what Bongers has found historically, I would concede that the storage figure would need to be at least 48 hours to cover most of the reduction in electrical energy production due to Wind Droughts, even if they occur every 5 years or so. Given the capital cost for such a level of storage, even Gen III/+ reactors such as the VVER 1200 would be cheaper to build and run than a 100% renewable network!
When I look at the charts above, all I can see is the gaping hole that is filled by GAS! Just turn the chart upside down. It’s huge! And when did gas cease to be a ‘fossil’ fuel? I hear that the retired firemen, in support of climate action, are now calling for a tax on fossil fuels in support of the Climate Cult’s propaganda, on the back of the summer bushfires. If gas is no longer regarded as a fossil fuel, then presumably it would be exempt from this kind of tax. Could this be one of the reasons for these ‘smoke and mirror’ tactics? If so, then this is hypocrisy pure and simple.
As for the COVID-19 situation in Victoria that is currently unfolding before our eyes, thanks to the spectacular mismanagement of the state government, my mind has turned to thoughts of a new advertising slogan for the state. Taking inspiration from the TV series, ‘The League of Gentlemen.’
Welcome to Victoria.
You’ll never leave!
This is the only kind of propaganda I am interested in…
PROPAGANDA – FROZEN FACES – Live on The Tube
Published by industrial82
I may be wrong, and I hope I am. It looks as if we’re heading towards 1000+ COVID-19 cases a day in Victoria!
How did we get here?
In my opinion, I think there is another area that should be given greater emphasis. And that is to literally try to exterminate this virus. Or in other words, fumigation! I would certainly like to see far more cleaning going on with disinfectant floor mats at the entrance to shops, supermarkets, etc so we can start to cut the spread of the virus. These were used during the last foot and mouth outbreak in the U.K. which is an area the government should be researching heavily, if they aren’t already! I draw the line at funeral pyres of course!
A possible candidate for extreme cleaning could be Colac in an effort to turn a negative situation into a positive one. The population would have to agree to it of course. If it worked, then the trial could be expanded. It goes without saying that it would have to be safe, but we need to explore every option.
Equally, it would be extremely helpful if we could find the technology to actually see the virus in the everyday environment.
Glen 20 household spray claims to be able to kill the virus. To quote the famous catchphrase from the U.K. television series University Challenge, there’s “Your starter for 10.”
During the last fortnight here in the U.K. the average daily wind energy I received as an individual was 1.17Kwhrs This being the total wind energy for the U.k. at 75Gwhs for the day. (total/population). Ok, enough to boil a kettle or two; but not much more. I hate to think what the costs were.
When the old Alcoa lines blew over at Lismore. The MacArthur turbines sat still for two weeks. They were that worried about Alcoa shutting down again. They ran the Mortlake gas station for that period till they got the lines fixed and back on coal power.
Brainless wind weasels are the only ones that believe in wind turbines.
Bruce I doubt even many of the wind weasels believe wind is a viable means of generation. The truth is more likely they (the denizens of the Climate Industrial Complex) know when they’re on a good thing. After all what better Ponzi scheme could there be than trousering the proceeds of taxing hot air?
Reblogged this on ajmarciniak and commented:
Australia’s wind industry has been suffering from the Big Calm – with dozens of occasions over the last month or so when the entire wind fleet’s battled to deliver more than a tiny fraction of its combined capacity.
Depicted above – courtesy of Aneroid Energy – is the output delivered by Australian wind power outfits to the Eastern Grid last month.
Spread from Far North Queensland, across the ranges of NSW, all over Victoria, Northern Tasmania and across South Australia its entire capacity routinely delivers just a trickle of its combined notional capacity of 7,728MW.
Collapses of over 3,000 MW or more that occur over the space of a couple of hours are routine, as are rapid surges of equal magnitude, which make the grid manager’s life a living hell, and provide the perfect set up for power market price gouging by the owners of conventional generators, who cash in on the chaos.
During June there were lengthy periods when the combined output of every wind turbine connected to the Eastern Grid struggled to top 400 MW (5.1% of total capacity). Such as: 11 June when output collapsed to a trifling 86 MW (1.1% of total notional capacity); 17 June when total output fell to 134 MW (1.7% of total notional capacity); 26 June when, after a 1,200 MW slide, output was between 300-400 MW (3.8% to 5.1% of total notional capacity); and 27 June when output dropped over 900 MW to bottom out at 96 MW (1.2% of total notional capacity) .
Rafe Champion delves into the consequences of Australia’s most recent Big Calm.
Reblogged this on uwerolandgross.
Here is TonyfromOz’s report for Saturday, 25thJul20. Confirms the absolute useless nonsense that is RE. https://papundits.wordpress.com/2020/07/26/australian-daily-wind-power-generation-data-saturday-25th-july-2020/