The claim that renewables are cheaper than coal, gas and nuclear is simply nonsense. There’s a reason why wind and solar obsessed Germany, Denmark and South Australia fight it out for the honour of paying the world’s highest power prices. Where conventional generators can be counted on to deliver 24 x 7, wind and solar deliver utter chaos.
Thanks to sunset and calm weather, wind and solar cannot and will never replace coal, gas or nuclear. To suggest otherwise is like joining Alice on a trip down the rabbit hole.
The notion that daylight and weather-dependent power sources can actually power an economy, in any serious and meaningful way, is the stuff of childish fantasies.
But that doesn’t stop zealots propounding the notion that a 100% all wind and sun powered future, is just around the corner. It’s a concept that requires banishing our good friends logic and reason to the naughty corner; and ignoring physics, mathematics and economics. And it’s that topic that Francis Menton tackles in grand style, below.
The Disasterous Economics of Trying to Power an Electrical Grid with 100% Intermittent Renewables
Manhattan Contrarian
Francis Menton
14 June 2019
The effort to increase the percentage of electricity generated by intermittent renewable sources like wind and solar inevitably brings about large increases in the actual price of electricity that must be paid by consumers. The price increases grow and accelerate as the percentage of electricity generated from the intermittent renewables increases toward 100 percent. These statements may seem counterintuitive, given that the cost of fuel for wind and solar generation is zero. However, simple modeling shows the reason for the seemingly counterintuitive outcome: the need for large and increasing amounts of costly backup and storage – things that are not needed at all in conventional fossil-fuel-based systems. And it is not only from modeling that we know that such cost increases would be inevitable. We also have actual and growing experience from those few jurisdictions that have attempted to generate more and more of their electricity from these renewables. This empirical experience proves the truth of the rising consumer price proposition.
In those jurisdictions that have succeeded in getting generation from renewables up to as high as about 30% of their total electricity supply, the result has been an approximate tripling in the price of electricity for their consumers. The few (basically experimental) jurisdictions that have gotten generation from renewables even higher than that have had even greater cost increases, for relatively minor increases in generation from renewables. As the percentage of electricity coming from renewables increases, the consumer price increases accelerate.
No jurisdiction – even an experimental one – has yet succeeded in getting the percentage of its electricity generated from the intermittent renewables up much past 50% on an annualized basis. To accomplish the feat of getting beyond 50% and on closer to 100%, the grid operator must cease relying on fossil fuel backup power for times of dark and calm, and move instead to some form of storage, most likely very large batteries. The cost of such batteries sufficient to power a jurisdiction of millions of people is enormous, and quickly comes to be the dominant cost of the system. Relatively simple calculations of the cost of batteries sufficient to get through a year for a modern industrialized area show that this cost would imply an increase in the price of electricity by a factor of some 15 or 20, or perhaps even more.
The burden of such increasing prices for electricity would fall most heavily on poor and low-income people.
The reason that increasing renewable generation leads to accelerating consumer prices is that an electrical grid must operate with one hundred percent reliability on a 24/7/365 basis. A reliable grid requires a very close match between power supplied and power demanded on a minute-by-minute, and even a fraction of second, basis. But wind and solar sources experience large, unpredictable, and often sudden swings in the power that they supply. Therefore, in a grid using large amounts of power from wind and solar sources, additional costly elements must be added to the system to even out the supply and always match it to the demand. These additional elements are what bring about the increased costs and thus increased consumer prices:
- In the early stages of moving toward increasing generation from intermittent renewables – say, to get 10% of the generation from the renewables — a grid operator can start by simply adding some new wind turbines or solar panels to the system, and by then accepting that power onto the grid when it is available. However, there will be substantial times when no such power is available (e.g., calm nights). Therefore, all or nearly all pre-existing fossil fuel capacity must be maintained, even though some of it may be idle much of the time. Although the fuel cost of the renewables is zero, the operator must pay the capital cost of two overlapping and duplicative systems to the extent of the renewable capacity.
- To get the percentage of generation from renewables beyond about 10% and into the range of 20-30%, the operator can then attempt a massive expansion of the renewable sources, such that the renewable capacity becomes equal to, or even a multiple of peak usage. (Jurisdictions including Germany and Denmark have followed this strategy.) With such massive renewable capacity, the system may even work without backup at some times of relatively low wind or thick clouds. However, no amount of excess capacity can make a wind/solar-only system generate any electricity on a completely calm night, nor any meaningful amount on a heavily overcast and calm winter day. If the backup comes from fossil fuel facilities, very nearly the full fleet must still be maintained. As wind/solar capacity goes to 100% and even 200% of peak usage, the capital cost of the system goes to double or even triple the capital cost of a fossil-fuel-only system. But, since much of the time will be dark and/or calm, still the percentage of electricity coming from the renewables will only be around 30%, and the decrease in carbon emissions from the backup fossil fuel plants will be even less, since they must often be kept on “spinning reserve” to be ready to step in when the wind and sun die.
- If the intent is to get the percentage of generation from wind and solar up above 30% and then to 50% and beyond, then by hypothesis the fossil fuel backup must be gradually phased out, to be replaced incrementally with some sort of storage as the percent of generation from renewables gets higher and higher. Batteries are the only feasible storage option in most locations. The amount of battery capacity needed accelerates as the percentage of generation from renewables approaches 100%. Due to seasonality of the availability of the wind and sun, most locations require a month or more of battery capacity to get a fully-wind/solar system through a year. The cost of the batteries is enormous, and quickly comes to dominate the cost of the system. In jurisdictions where a calculation has been made, the cost of the batteries exceeds the full annual GDP of the jurisdiction, and implies an increase in the price of electricity by a factor of 15, 20 or more.
In a post at the website Energy Matters on November 22, 2018, Roger Andrews set forth a detailed analysis of what it would take to get to an electricity grid powered 100% by wind and solar sources, backed up by batteries. Mr. Andrews’s post is available at this link: http://euanmearns.com/the-cost-of-wind-solar-power-batteries-included/ Andrews’s study covers two cases, Germany and California. His analysis is detailed, but not complicated, and can be replicated or challenged by anyone competent at basic arithmetic.
Andrews collects data for day-by-day power generation for a full year from existing wind and solar sources for both Germany and California. That data immediately reveals a fundamental issue, which is that the wind and sun are not only intermittent within a given day or week, but they also vary greatly from season to season. Thus, for example, in California, both the wind and the sun produce substantially more power in the summer and fall than in the winter and spring. That means that to have a fully-wind/solar system in California backed up with batteries, you need the batteries to store power from April to October, to be discharged from November to March. The total amount of storage needed comes to some 25,000 GWh for a year, equal to more than a full month’s current rate of usage. The batteries for such an effort – even assuming some substantial declines from current prices – will cost something in the range of $5 trillion, which is more than the full annual GDP of California. And these batteries will need to be replaced regularly.
Andrews concludes:
The combined wind + solar LCOE [Levelized Cost of Energy] without storage was $50/MWh. . .
I then estimated wind + solar LCOEs with battery storage capital costs included. This was a straightforward exercise because reducing baseload + load-following generation in direct proportion to the increase in wind + solar generation results in LCOEs that are the same regardless of the percentage of wind + solar in the generation mix. The NREL calculator showed:
· LCOE Case A [Germany]: $699/MWh
· LCOE Case B [California]: $1,096/MWh
These ruinously expensive LCOEs are entirely a result of the added costs of storage batteries, which in the 100% wind + solar scenarios approach $5 trillion in both Case A [Germany] and Case B [California], compared to wind + solar capital costs of ~$300 billion in Case A and ~$160 billion in Case B.
Assuming that these additional costs are passed on to consumers in electricity prices, this would represent price increases of a factor of about 14 for Germany and 22 for California. (The difference derives from lesser seasonality in Germany than California.)
Although no jurisdiction has yet tried to test Andrews’s calculations by pushing generation from renewables much beyond 50% and toward 100%, many have gone down the road of pushing generation from renewables to the range of 30%, and some experimental jurisdictions have gotten to 50% and a little beyond. Substantial data exist to demonstrate the results on the cost of the resulting electrical system, and thereby what the effect would be on price to consumers assuming that the full cost is borne by the consumer. (The experimental jurisdictions have thus far not imposed the bulk of the costs on the consumer, but that approach would likely not work for an entire country.)
The following chart, initially prepared by Willis Eschenbach of the website WattsUpWithThat, shows the near linear relationship between installed renewables capacity per capita (in watts/capita) on the x-axis and cost of electricity to the consumer (in cents per kilowatt hour) on the y-axis, where each point is a country. The chart is available at the following link: https://wattsupwiththat.com/2015/08/03/obama-may-finally-succeed/
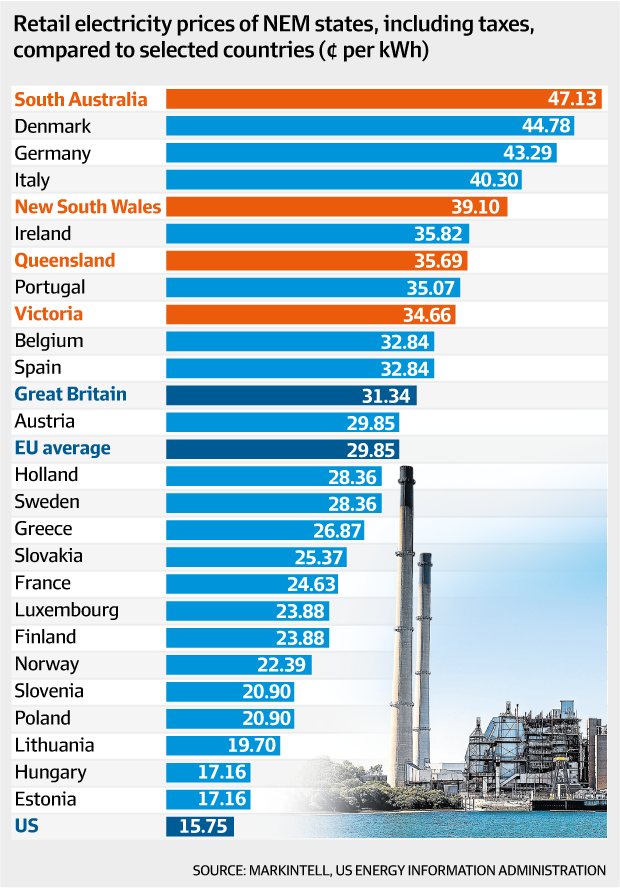
Germany is the leader in Europe in its power generation per capita from renewables, through its so-called Energiewende, having gotten the percentage of its electricity from wind and solar all the way up to about 30%, and at times somewhat beyond. However, the consequence of that effort has been an approximate tripling of the cost of electricity to consumers, to about 30 cents per kWh. (The average consumer price of electricity to the consumer in the U.S. is approximately 10 cents per kWh.) Analyses of the soaring price of electricity in Germany place the blame squarely on excess costs that have been necessarily incurred to try to get to a stable, functioning, 24/7 system with so much input from intermittent renewables.
First, massive “excess” wind and solar capacity has been installed to try to deal with days of light wind and heavy clouds. And for the completely calm nights and overcast winter days when the wind and solar sources produce nothing or next-to-nothing, nearly the entire fleet of fossil fuel plants has been maintained and ready to go, even though those sources end up being idle much of the time. (Actually, since Germany during this time has been shutting down all of its nuclear power plants, it has been building additional coal plants to back up its renewables.) And then, some means have had to be found to deal with the surges of available electricity when the wind and sun suddenly blow and shine together at full strength at the same time.
As noted by Benny Peiser at the Global Warming Policy Foundation on April 4, 2015 (http://www.thegwpf.com/benny-peiser-eus-green-energy-debacle-shows-the-futility-of-unilateral-climate-policies/):
Every 10 new units worth of wind power installation has to be backed up with some eight units worth of fossil fuel generation. This is because fossil fuel plants have to power up suddenly to meet the deficiencies of intermittent renewables. In short, renewables do not provide an escape route from fossil fuel use without which they are unsustainable. . . . To avoid blackouts, the government has to subsidize uneconomic gas and coal power plants. . . . Germany’s renewable energy levy, which subsidizes green energy production, rose from 14 billion euros to 20 billion euros in just one year as a result of the fierce expansion of wind and solar power projects. Since the introduction of the levy in 2000, the electricity bill of the typical German consumer has doubled.
To further illustrate the relationship between the percentage of electricity from renewables and cost of electricity to the consumer, consider the case of California. California is a “leader” in the United States in generating power from wind and solar sources. According to the California Energy Commission, in 2016 California got 8.11% of its electricity supply from solar and 9.06% from wind, for a total of 17.17% from those two intermittent sources. See http://www.energy.ca.gov/almanac/electricity_data/total_system_power.html. For the U.S. as a whole the percentage of generation from wind and solar was 6.5%. See https://www.eia.gov/tools/faqs/faq.php?id=427&t=3.
According to the U.S. Energy Information Agency, California’s average electricity price that year was 14.91 cents per kWh, versus a U.S. average of 10.10 cents per kWh; that is, almost 50% higher. See https://www.eia.gov/electricity/monthly/epm_table_grapher.cfm?t=epmt_5_6_a.
There are only a handful of small jurisdictions that have tried to get the percentage of their electricity generation from renewables up much beyond the 30% achieved by Germany. But those jurisdictions have not achieved levels much beyond that of Germany, and even those levels have been achieved only at high and accelerating costs. One such jurisdiction is Gapa Island, a small island of only 178 people (97 households) in South Korea. A report on the Gapa Island Project appeared on the Hankyoreh news site in July 2016 (http://english.hani.co.kr/arti/english_edition/e_national/752623.html).
With average electricity usage of 142 kw, and maximum usage of 230 kw, the islanders installed wind and solar capacity of 674 kw – about three times maximum usage, to deal with light wind and low sun. They also bought battery capacity for about eight hours of average usage. The cost of the wind and solar capacity plus batteries was approximately $12.5 million, or about $125,000 per household. And with all that investment the islanders were still only able to get about 42% of their electricity from the sun and wind when averaged over a full month. Even with the storage, they still needed the full fossil fuel backup capacity.
Applying a reasonable cost of capital to a system like that of Gapa Island, and considering additional elements of a system, like additional storage, that would be necessary to push the percent of total generation from renewables to higher levels, one can calculate that a system like the Gapa demonstration project for the full United states would lead to electricity prices of at least five timestheir current level, and more likely, far higher. And even then, the U.S. would be hard-pressed to achieve 50% of electricity from the intermittent renewables.
A somewhat larger demonstration project on the Spanish island of El Hierro (population about 10,000) has had similar results. The idea on El Hierro was to combine a massive wind farm with a large elevated reservoir to store water, which would then be released at times of low wind to balance the grid. El Hierro has the good fortune of a mountainous geography, so that a large reservoir could be placed at a relatively high elevation, in close proximity to the consumers of the electricity. The investment in the wind/water system was approximately 64.7 million euros, or about $80 million – which was on top of what was already a fully-functioning fossil fuel-based system, all of which still needed to be kept. Operations of the El Hierro project began in 2015 with high expectations for 100% renewable generation, but it has not come close.
An operations review of the El Hierro system from inception through 2017 by Roger Andrews can be found at http://euanmearns.com/el-hierro-end-2017-performance-update/. During 2017 the percent of generated electricity that came from renewables ranged from 62.4% in September down to only 24.7% in November, with the overall average for the year at about 40%. Based on the data from actual operations, Mr. Andrews calculates that, to achieve the goal of 100% generation from the wind/water project, El Hierro would need to increase its wind turbine capacity by some 50%, and the capacity of its reservoir by a factor of 40. Clearly, there is no place on the island to put such a massive reservoir; and if there were, the cost would be not in the millions, but in the billions. And that would be for a mere 10,000 people.
A further update of performance of the El Hierro system by Mr. Andrews covering the 2018 year appeared at the Energy Matters site on January 6, 2019, and can be found at http://euanmearns.com/el-hierro-fourth-quarter-2018-performance-update/ During 2018, the El Hierro system supplied 56.6% of the island’s electricity (which represented only 13.0% of its total energy usage). However, the production from the system varied widely over the course of the year, producing as much as 74.2% of the island’s electricity in 3Q 2018, but only 27.7% in 4Q. The 27.7% electricity generation in 4Q represented only 6.4% of the island’s total energy usage.
The geography of the United States does not permit a water storage system like that of El Hierro for most parts of the country. As discussed above, the alternative of storage by large batteries, such as the type used for Tesla automobiles, carries truly astounding potential costs, potentially multiplying the cost of electricity by well more than a factor of 10, and even by a factor of 20 and more.
Such an economic jolt would hit everyone in the country hard, with the possible exception of some of the very wealthiest people. Even middle and upper middle-income people would be forced to make major reductions in their energy consumption. But poor and low-income people would be hit by far the hardest. If electricity prices went to ten or twenty times current levels, most low-income people would be almost completely priced out of things they now take for granted, like light, refrigeration and computers. They would be forced into energy poverty. This is the route down which the Clean Power Plan, but for the Supreme Court’s stay, would surely have taken us – on the now thoroughly discredited assumption that CO2is a pollutant (SeeSection II above).
A new study by IHS Markit, titled Ensuring Resilient and Efficient Electricity Generation: The Value of the Current Diverse U.S. Power Supply Portfolio considered the economic effects of state and federal energy policies that are driving electric utilities away from coal, nuclear and hydroelectric and towards renewables and natural gas.Such policies are forecast by IHS Markit to lead to a tripling of the current 7% reliance on wind, solar and other intermittent resources, with natural gas-fired resources supplying the majority of generation.
The Study’s Findings are that current policy-driven market distortions will lead to:
U.S. power grid becoming less cost-effective, less reliable and less resilient due to lack of harmonization between federal and state policies and wholesale electricity market operations, …
Id. at p. 4 (Emphasis added).
The study forecast that these policies will cause significant increases in the retail price of electricity. The following economic impacts of these price increases were forecast:
The 27% retail power price increaseassociated with the less efficient diversity case causes a decline of real US GDP of 0.8%, equal to $158 billion (2016 chain-weighted dollars).
Labor market impacts of the less efficient diversity case involve a reduction of 1 million jobs.
A less efficient diversity case reduces real disposable income per household by about $845 (2016 dollars) annually, equal to 0.76% of the 2016 average household disposable income.”
Id. at p. 5. (Emphasis added).
It should be noted that the projected 27% increase in average retail power prices is predicated on the wind and solar renewables share rising by three-fold from 7% to “only” about 21%. The case studies discussed above make very clear the enormous increases in power prices that would result as policy makers attempt to move the renewables share higher than that.
Moreover, the study found that current state and federal policy-driven market distortion will imply:
Increased variability of monthly consumer electricity bills by around 22 percent; and an additional $75 billion per hour cost associated with more frequent power supply outages.
Id. (Emphasis added).
The study’s lead author commented that“[d]iversity of supply is an essential bedrock for security and reliability for an electric power system that is as big and diverse—and as crucially important—as that of the United States.”See http://news.ihsmarkit.com/print/node/23497
Moreover, policies that promote increased use of wind and solar would likely result in little to no reduction in the level of electric sector CO2 emissions:
Ironically, addressing climate change concerns with federal and state policies to subsidize and mandate wind and solar electric generation produced the unintended consequence of distorting wholesale electricity market clearing prices and driving the uneconomic closure of nuclear power plants—a zero-emitting source. The result has been some power system CO2 emissions remaining constant or increasing.
Manhattan Contrarian


Heard China is dumping solar and wind and going back to coal. These technologies are mainly just junk and have to be subsidized by governments. which defeats the purpose of even having them in first, we paying more taxes to pay for new thechnologies to reduce co2 which is suppose to mkae things cheaper and all which has pushed our expensises up, what a pile shit. australia is the most energy rich counry in the world and we paying for co2 which does not even exist in atmosphere what lies, to hell with corrupt UN and chinas push to sell more shit solar panels. biggest scam in history
Reblogged this on ajmarciniak.
funny how these figures never reach the globalist conrolled fake media.
Yep! You certainly won’t see it being broadcast on ‘their ABC’!
Incidentally, we had gerbil warming protesters in Brisbane today blocking off streets in the city during peak hour for 10 minutes at a time.
I wonder who will be the first frustrated commuter to take some unfortunate action against one of those protesters?
It’s going to happen. The politicians and the police must be aware that it is bound to happen.
Reblogged this on Climate- Science.