
Believe the hype, and you’d think that we’re already being powered almost exclusively by sunshine and breezes. Well, the facts say otherwise. Despite squandering hundreds of billions of dollars in subsidies, forcing power retailers to adhere to mandated targets etc, etc, over the last 30 years – the combined contribution of wind and solar remains little more than a rounding error.
And yet, the mainstream media has it that we’re well on our way to an all wind and sun powered future.
No country has ever powered itself entirely on wind and solar. No country ever will.
Here’s some numbers that prove our point.
Fossil Fuels vs. Climate Politics: Two Graphs
Institute for Energy Research
Robert Bradley
15 May 2019
An important statistic in the historiography of climate policy compares the global market share of fossil fuels from 1988 (the beginning year of the climate debate) to today.
How has global warming politics changed global energy usage in the last 30 years? Restated, how much fossil-fuel demand has been redirected by climate policies?
The first chart below shows the steadiness of carbon-based energy since the 1980s with the balance divided between carbon-free energies.
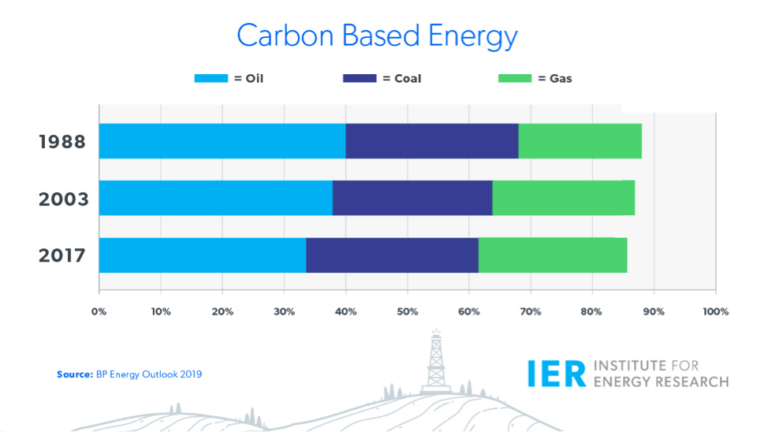
Overall, fossil fuels fell from an 88 percent share in 1988 to 85 percent today, suggesting a floor of 80 percent going into the next years if not decades. According to the BP Energy Outlook, world coal has remained steady at 28 percent of total primary energy usage, while natural gas rose to 23 percent (from 20 percent), a 15 percent gain. Oil’s market share dropped from 40 percent to 34 percent, mostly attributable to lost demand in the industrial/power plant market.
The second chart shows the composition of non-carbon-based energies (renewables and nuclear power), accounting for 11 percent in 1988. With the growth of non-hydroelectric renewables (primarily wind and solar power), this share grew to 15 percent in the most recent year.
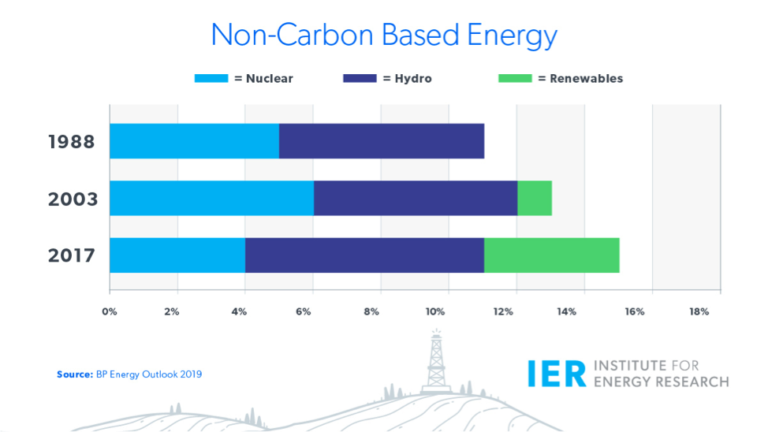
Globally, hydroelectric generation increased its share of total primary energy consumption to result in a net gain for carbon-free energy despite a marked fall in nuclear generation. Non-hydroelectric renewables had a market share of 3.6 percent in 2017, despite contributing almost nothing to global consumption in 1988.
Another way to assess thirty years of activist public policy versus consumer demand is to look at total fossil-fuel consumption and carbon dioxide emissions. Between 1988 and 2017, according to BP’s Statistical Review of the World, carbon-based energy usage increased 66 percent, while CO2 emissions rose by slightly less—61 percent.
Conclusion
After three decades of debate and politics, carbon-based energies continue to predominate over highly subsidized and mandated alternatives. Growing world demand and improving technology from extraction to combustion have overcome political interference, as it were. This story is unlikely to change much in the next decades.
It’s a fossil-fuel world. Self-interested consumers are choosing the most abundant, portable, storable, reliable energies. For climate activists, meanwhile, the postulated CO2 emissions mitigation path to climate “stabilization” grows ever more politically impossible, leaving free-market adaptation as the real-world alternative—and societal verdict.
Institute for Energy Research


Angus Taylor ” sees a “strong role” for commercially viable renewables like wind and solar power, alongside continued focus on coal and gas.” Energy Matters 30th August 2018.
I hope a strong election win gives him the courage to say that wind and solar are not viable now and never will be. If the Coalition doesn’t act early and end the era of wind and solar they won’t act at all.
Reblogged this on ajmarciniak.
How much of the 3.6% attributed for 2017 to non-hydro renewables comes from the burning of wood as an alternative to coal?
Depends where you are. In Europe, wood and other ‘bio-mass’ dominate the share of what’s classed as renewable:
According to Eurostat — that’s the official EU statistical body — 65 per cent of EU renewable generation in 2016 came from biomass: wood and charcoal, biogas and biofuels, and municipal waste.
Burning wood was easily the biggest, at nearly half all so-called renewable generation in Europe.
You can read more here:
Does the non hydroelectric renewables figure of 3.6 % contribution to renewables overall contribution include the burning of ‘biomass’ (ie wood)?
Yes, that’s how we read it.
Reblogged this on Climate- Science.