****
Yesterday, we laid out the wind power fraud in pictures, as it’s perpetrated in, what’s referred to as, ‘Australia’s wind power capital’, South Australia:
The Wind Power Fraud (in pictures): Part 1 – the South Australian Wind Farm Fiasco
To call the ‘performance’ of SA’s 17 wind farms (spread over a vast area of the State – with an installed capacity of 1,477MW) over the last few months “diabolical” is to flatter them.
But to draw focus to the wind power debacle being played out in a single State, is to allow the greentard wind power barracker the chance to ‘slip the rail’; and attempt to escape the facts with a retort that – ‘with the wind always blowing somewhere’ – all you need to do is add thousands more turbines, spread them far and wide, and you’ll have dependable wind power coming out of your ears – the ‘distributed wind power generation’ myth (see this piece of pure fantasy from ruin-economy, for example).
In this post, as we’ve done before (see our post here) we smash the ‘distributed wind power generation’ myth – once again, using pictures to tell the tale.
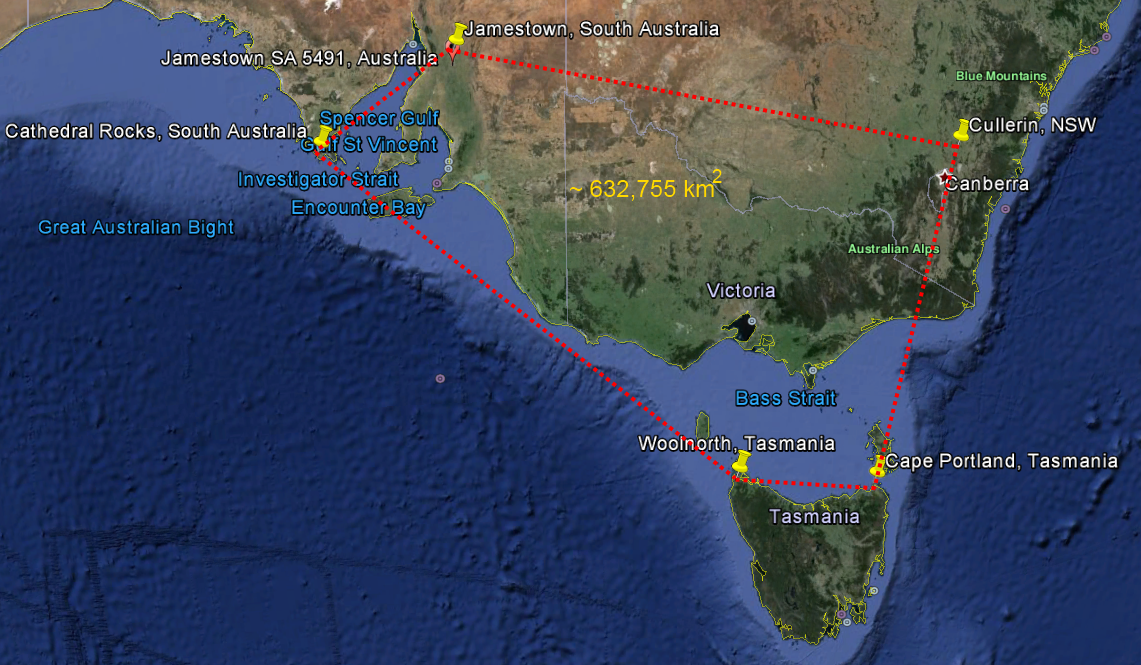
As depicted above, on the Eastern Grid Australia’s wind farms are located in 4 States – Tasmania, South Australia, Victoria and NSW – and spread from: Jamestown in the Mid-North, west to Cathedral Rocks on lower Eyre Peninsula and south to Millicent in South Australia; down to Cape Portland (Musselroe) and Woolnorth (Cape Grim) in Tasmania; all over Victoria; and right up to Cullerin on the New South Wales Tablelands.
Those wind farms have hundreds of these things spread out over a geographical expanse of 632,755 km². That’s an area which is 2.75 times the combined area of England (130,395 km²) Scotland (78,387 km²) and Wales (20,761 km²) of 229,543 km².
So let’s take a look at some of the national wind power data from the last 3 months, courtesy of Aneroid Energy.
We’ll start with Australia’s wind power ‘May-hem’. Here’s the chaos delivered by all of the Australian wind farms connected to the Eastern Grid for the month of May (oh, and if the graphs appear fuzzy, click on them and they’ll pop up crystal clear in a new window).
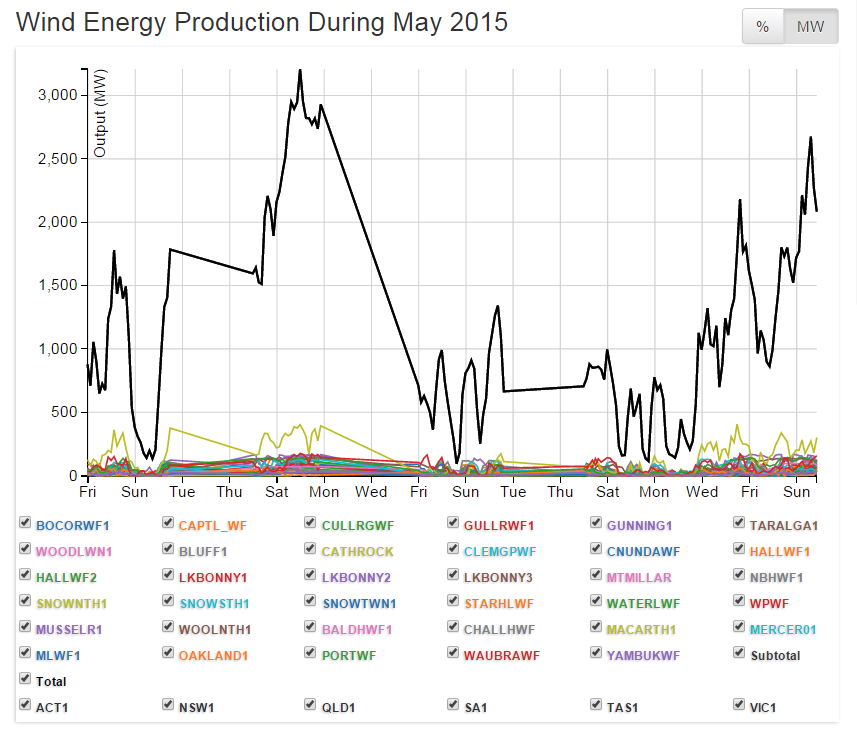
Looking a bit like the meanderings of a drunken spider that had dipped one leg in the ink-well and staggered over the page, that’s the nonsense that wind farms can deliver power as an “alternative” to on-demand power generation sources such as hydro, gas and coal belted, yet again.
With 31 ‘chances’ to make a meaningful contribution to lighting up the 1.4 million homes said by wind power outfits to be ‘powered’ by their wind farms – output collapses 7 times to less than 250MW – or less than 6.8% of the total installed capacity of 3,669MW.
Here’s the total output from all wind farms on the Eastern Grid for June 2015.
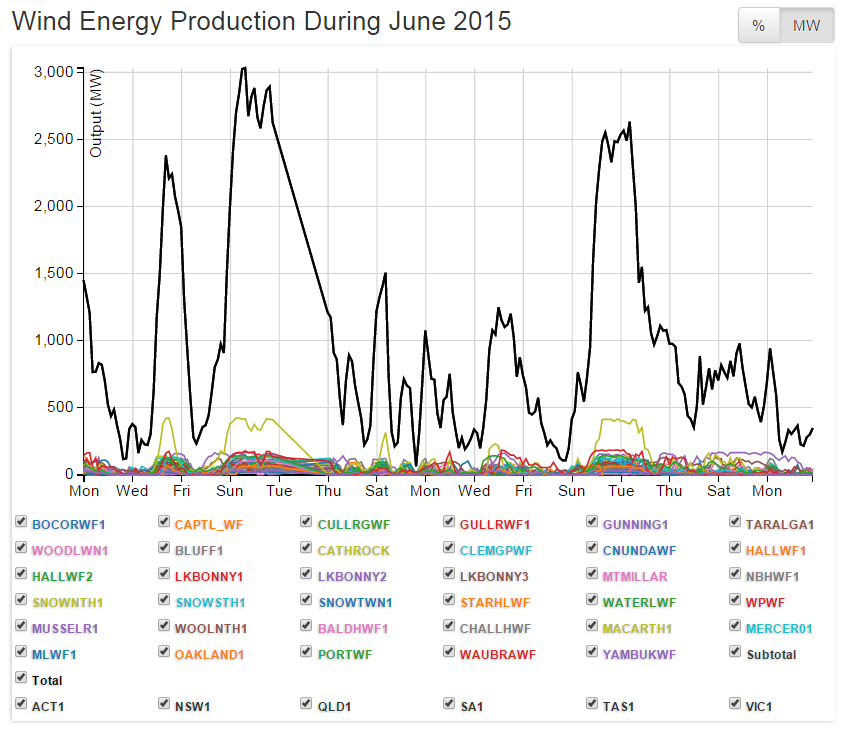
Having had a pretty restful May, you’d think Australia’s wind farms would be ready for a better effort in the cool of June. But, oh no – not so.
With 10 crashes to less than 250MW – or less than 6.8% of total capacity – and 3 of those to less than 100MW – or less than 2.72% of capacity, the suggestion that wind power is ‘killing coal’ – or gas or anything other than birds and bats – looks just plain silly.
Here’s the total output from all wind farms on the Eastern Grid for the start of July 2015.
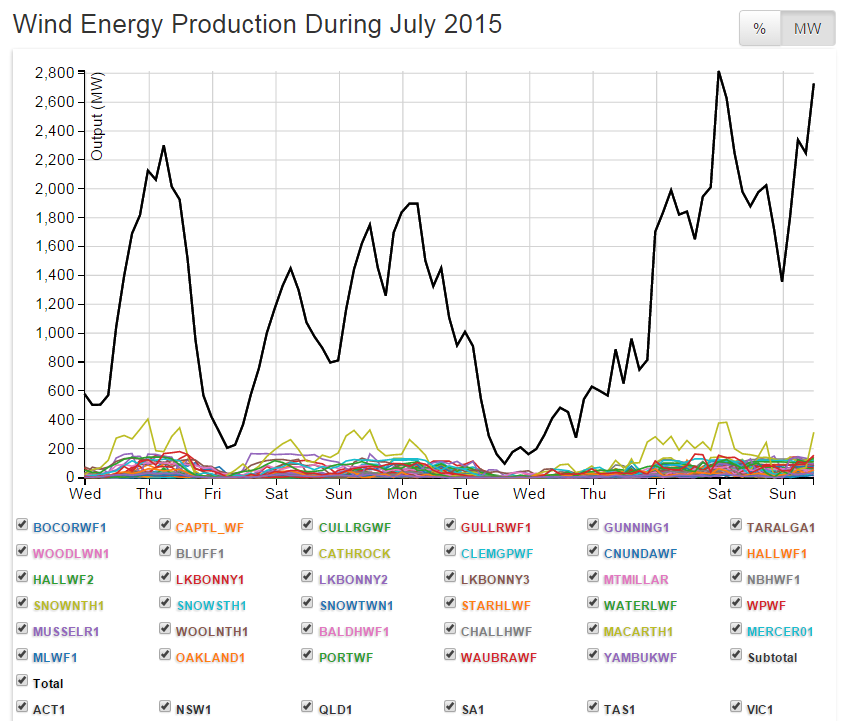
Looking more like the inadvertent doodling on the dog-eared message pad kept next to the phone in the hall, July’s effort ain’t much better than the months before. A couple of short-lived ‘spurts’ aside, and the rest is largely a ‘joke’: crashing by around 2,000 MW in the space of a few hours; and almost repeating the ‘performance’ a few days later with a precipitous plummet of around 1,800 MW – makes it pretty clear that the words ‘reliable’ and ‘wind power’ don’t belong on the same page, let alone in a sensible sentence.
Having taken a ‘helicopter view’, we’ll zoom in now – for a closer look at some of the more outlandish results on: May 3, 16, 25 and 26; June 12, 13, 14, 16, 17, 20, 29 and 30; and July 2, 3 and 7.
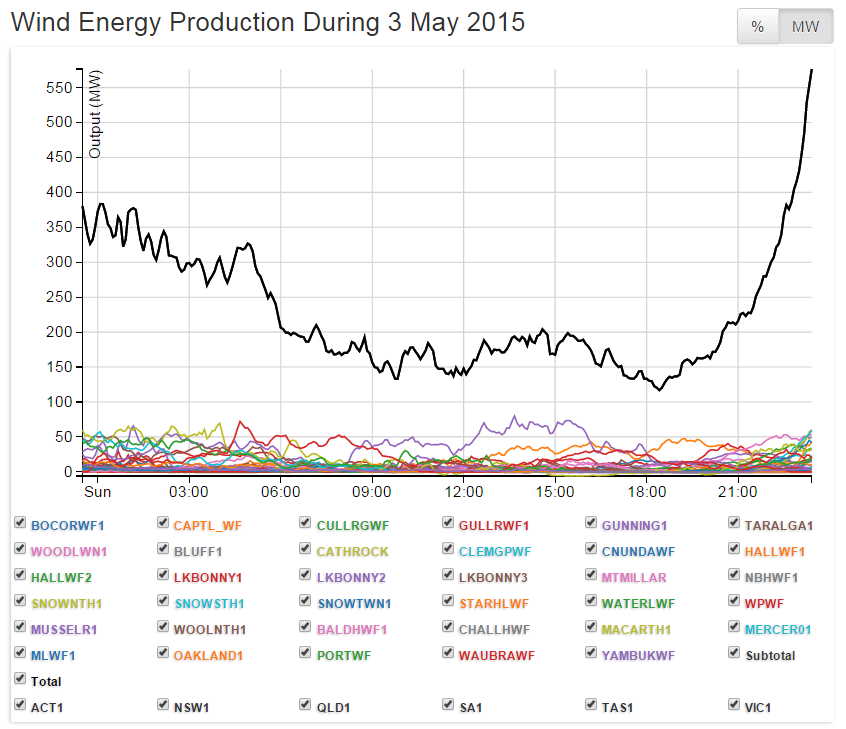
Entire Eastern Grid – 3 May 2015 – from 6am to 8pm (14hrs):
Total wind farm output: 6am to 8pm – less than 200MW, falling to 125MW at 10am and 7pm.
Output as a percentage of total installed wind farm capacity: 8am to 8pm – 5.0%, falling to 3.1% at 10 am and 7pm.
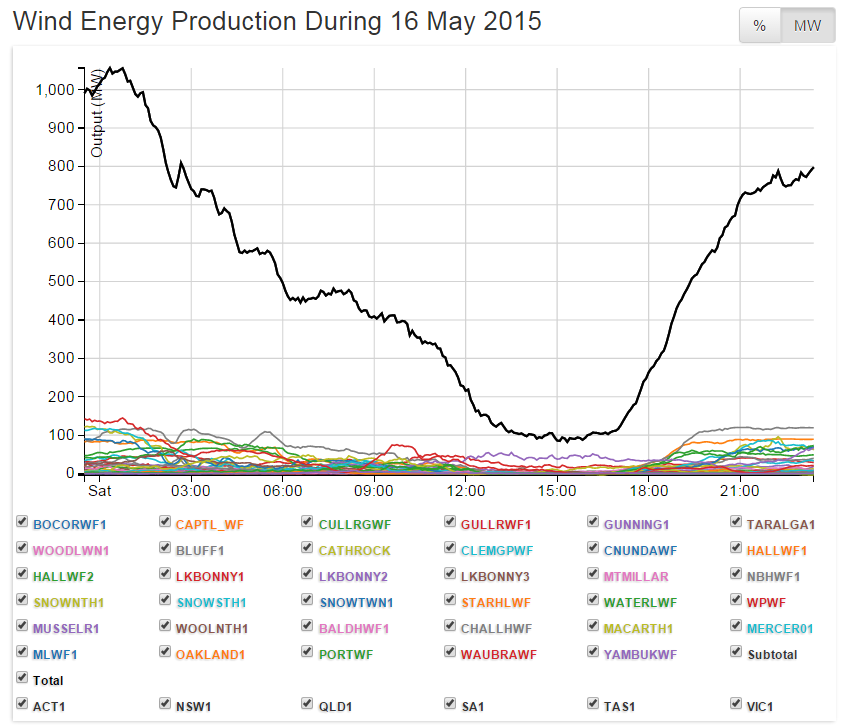
Entire Eastern Grid – 16 May 2015 – from 1am to 1pm – a collapse of 1,000MW – from 1,100MW to 100MW – or a drop in output of 91%:
Total wind farm output: from 12 noon to 5pm (5hrs) – never more than 200MW; from 1pm to 4pm (3hrs) – never more than 100MW.
Output as a percentage of total installed wind farm capacity: from 12 noon to 5pm (5hrs) – never more than 5.4%; from 1pm to 4pm (3hrs) – never more than 2.7%.

Entire Eastern Grid – 25 May 2015 – from 7am to 10am – a spectacular crash from around 750MW to around 210MW – at a rate of 160MW/hr – representing a 68% collapse in output.
Then – from 10am to midnight (14hrs) – never above 250MW and falling to 100MW at 4pm. From 7pm to 11 pm – an average output of 150MW.
Output as a percentage of total installed wind farm capacity: 10am to midnight – 6.2%, falling to 2.5% at 4pm – with a 4 hour stretch hovering around 3.75%.
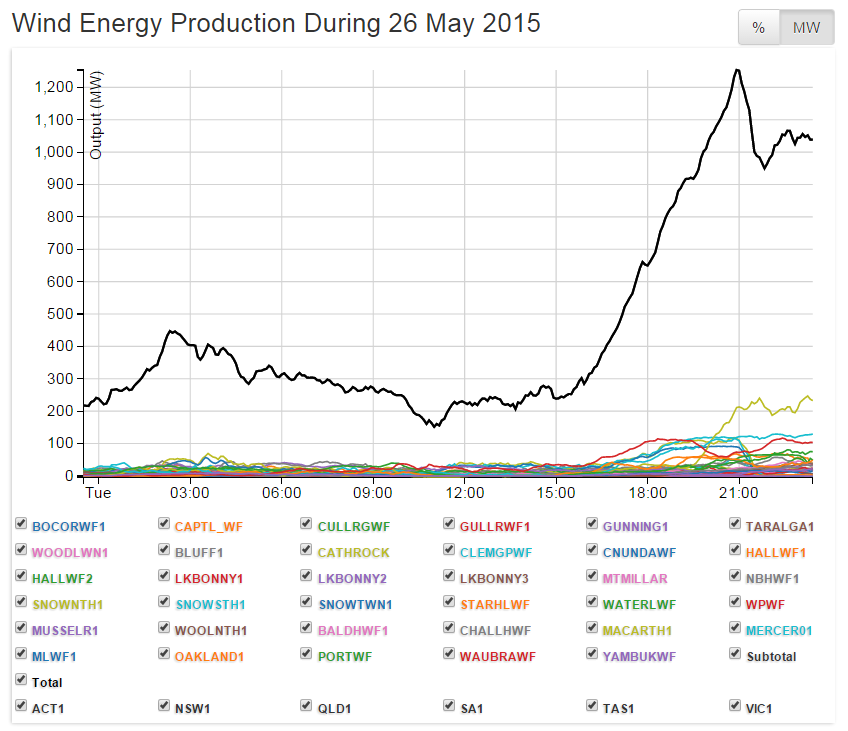
Entire Eastern Grid – 26 May 2015 – from midnight to 4pm (14hrs):
Total wind farm output: midnight to 4pm – less than 400MW, falling to 150MW – 10am to 11am.
Output as a percentage of total installed wind farm capacity: midnight to 4pm – 10%, falling to 3.75% – 10am to 11am.
Now for a closer look at June 2015.
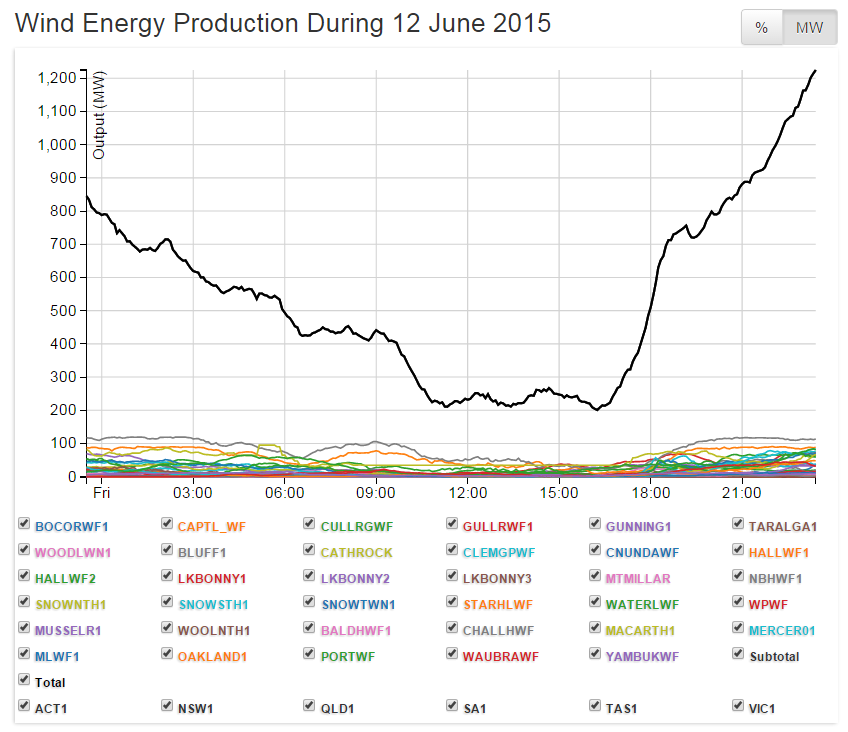
Entire Eastern Grid – 12 June 2015 – from 11am to 5pm (6hrs):
Total wind farm output: never more than 250MW, dropping to 200MW on 3 occasions.
Output as a percentage of total installed wind farm capacity: 11am to 5pm – 6.25%; falling to 5% – 11am, 1pm and 4.30pm.
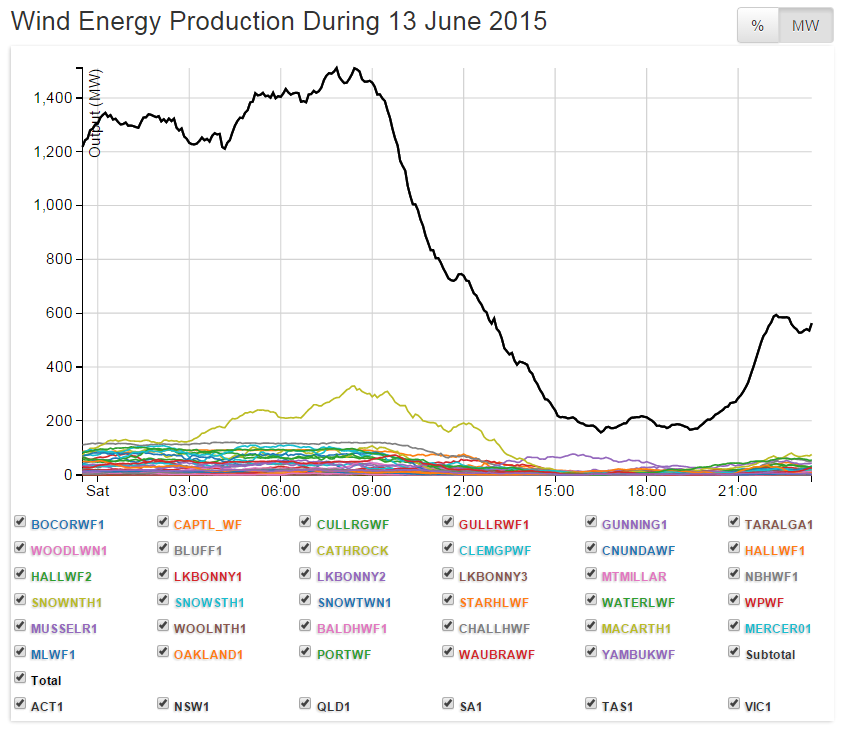
Entire Eastern Grid – 13 June 2015 – from 9am to 3pm (6hrs) a collapse of over 1,300MW – from 1,500MW to less than 200MW – at a rate of 216 MW/hour.
Total wind farm output: 3pm to 8pm (5hrs) is 200 MW.
Output as a percentage of total installed wind farm capacity: 3pm to 8pm – 5%.

Entire Eastern Grid – 14 June 2015 – from 8am to 1pm a collapse of 700MW – from 750MW to 50MW being an 87% drop in output over 5hrs; then from 1pm to 4pm (3hrs):
Total wind farm output: from 1pm to 4pm (3hrs) output drops to less than 100MW – from 2pm to 4pm – around 50MW.
Output as a percentage of total installed wind farm capacity: 1pm to 4pm – 2.5%; falling to 1.25% – 2pm to 4pm.
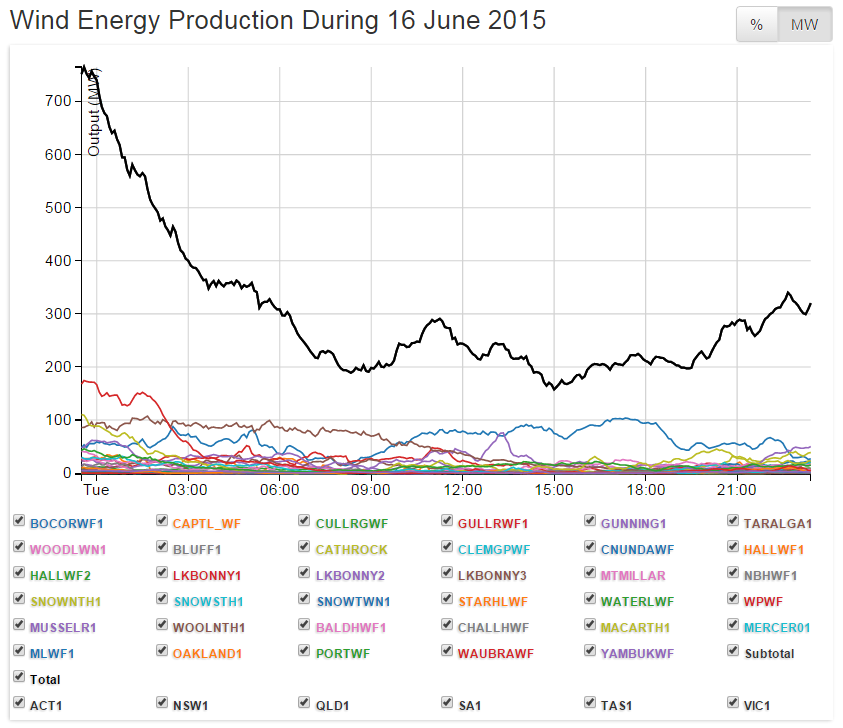
Entire Eastern Grid – 16 June 2015 – from midnight to 7am a collapse of 600MW – from 800MW to 200 MW – a 73% drop in output over (7hrs); then 14 hours of piddling production for the rest of the day.
Total wind farm output: 8am to 10pm is 200MW – at 3pm dropping to 150MW.
Output as a percentage of total installed wind farm capacity: 8am to 10pm – 5%; falling to 3.75% – at 3pm.
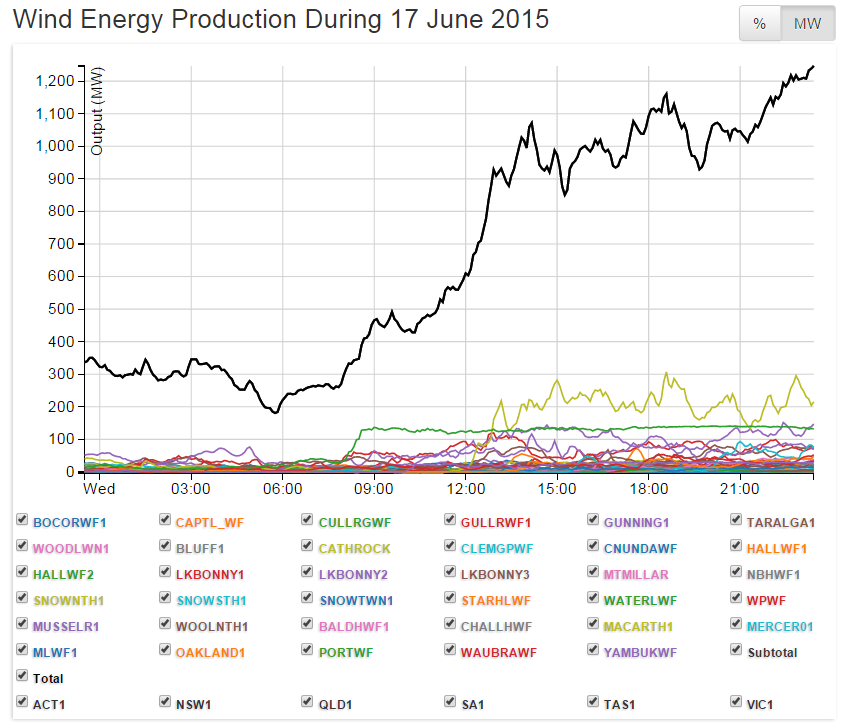
Entire Eastern Grid – 17 June 2015 – from midnight to 8am (8hrs).
Total wind farm output: midnight to 8am never more than 350 MW, dropping to 200MW at 6am.
Output as a percentage of total installed wind farm capacity: midnight to 8am – 7.5%; falling to 5% – at 6am.
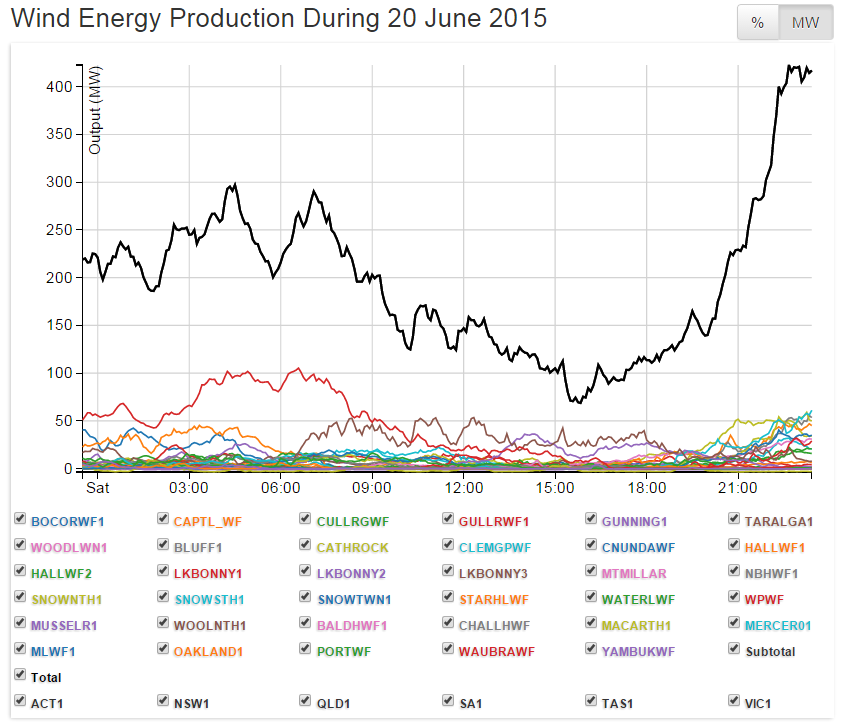
Entire Eastern Grid – 20 June 2015 – from midnight to 10pm (22hrs).
Total wind farm output: from midnight to 10pm never more than 300MW – from 10am to 8pm never more than 150 MW – dropping to 70MW at 4pm.
Output as a percentage of total installed wind farm capacity: midnight to 10pm – 7.5%; 10am to 8pm – 3.75%; falling to 1.75% – at 4pm.
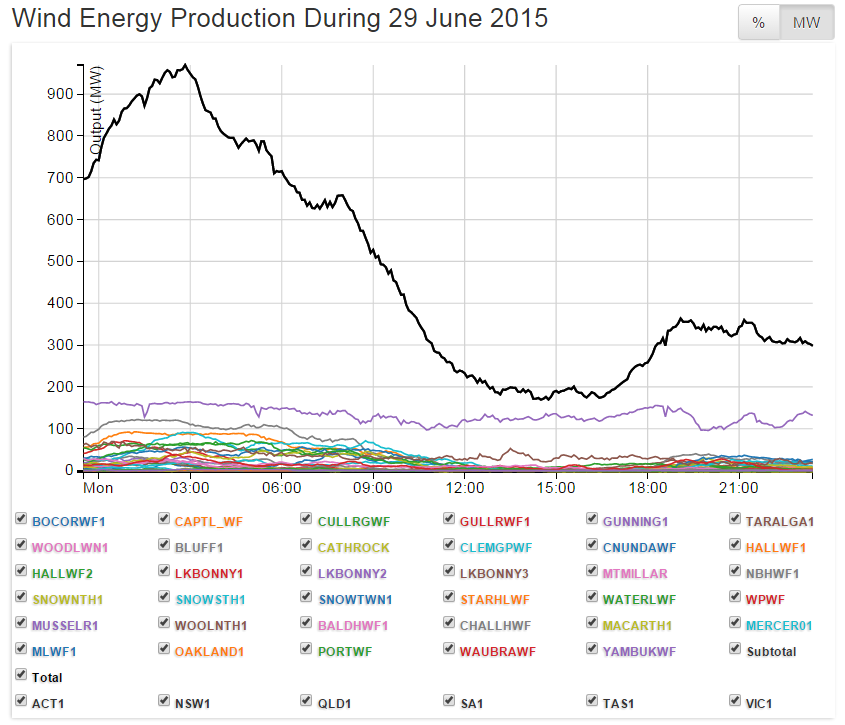
Entire Eastern Grid – 29 June 2015 – a drop of 800MW – from 1,000MW to less than 200MW from 3am to 1pm – an 80% collapse in output. From midday to 5pm (5hrs) and 6pm to midnight (6hrs):
Total wind farm output: From midday to 5pm (5hrs) – 200 MW; and from 6pm to midnight (6hrs) – around 330MW.
Output as a percentage of total installed wind farm capacity: From midday to 5pm – 5%; and 6pm to midnight – 8.25%.
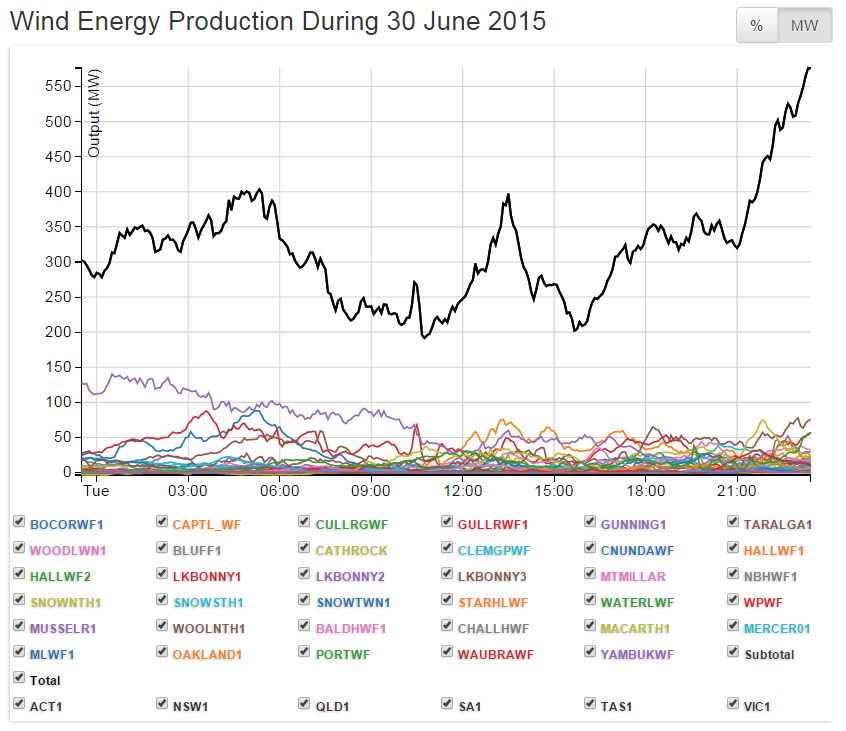
Entire Eastern Grid – 30 June 2015 – from midnight to 10pm (22hrs).
Total wind farm output: midnight to 10pm – never more than 400MW; 7am to noon – around 250MW; with drops to 200MW at around 11am and 5pm.
Output as a percentage of total installed wind farm capacity: midnight to 10pm never above 10%; 7am to noon – 6.25%; and falling to 5% – at 11am and 5pm.
Now for for a look at July, so far.

Entire Eastern Grid – 2 July 2015 – a collapse of 1,900MW – from 2,300MW to 400MW – or an 81% drop in output – over 12 hrs – from 7am to 9pm.
Total wind farm output: 9pm to midnight – 400MW
Output as a percentage of total installed wind farm capacity: 9pm to midnight – 10%.

Entire Eastern Grid – 3 July 2015 – continuing from midnight and the 400MW output finish on 2 July (see the previous graph).
Total wind farm output: 3am to 10am – 200MW.
Output as a percentage of total installed wind farm capacity: 3am to 10am – 5%.
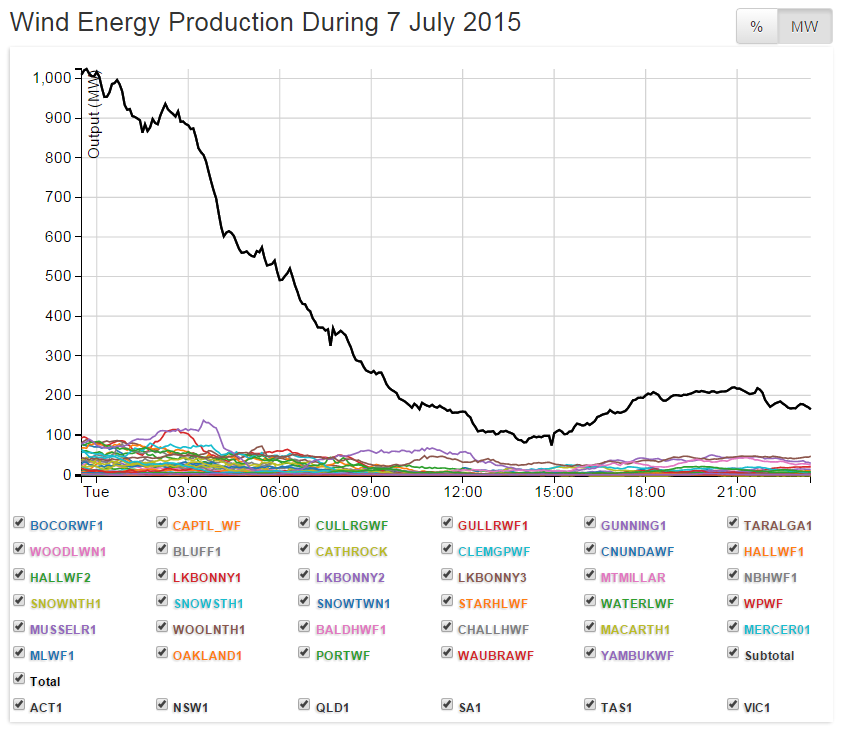
Entire Eastern Grid – 7 July 2015 – from midnight to noon – a collapse of over 900MW – from 1,000MW to less than 100MW – or a drop of 79% in output over 12hrs.
Total wind farm output: 10am to midnight never much more than 200MW; and from 1pm to 4pm – less than 100MW.
Output as a percentage of total installed wind farm capacity: 10am to midnight – 5%; and 1pm to 4pm – less than 2.5%.
We’re bored now – we’ve made our point.
When you have 3,669MW of installed capacity – connected and spread over an area more than twice the size of Great Britain – producing less than 200 MW for hours on end – and, on plenty of occasions, less than half that figure – the idea that wind power is providing (or could ever provide) “base-load” power – or even power “on demand” – by having wind farms spread far and wide is just plain silly. [For more of the same – see our posts here, here and here and here and here and here and here.]
At STT we love scorching wind power myths – and all the more so when it can be done with pictures.
The ‘arguments’ pitched up by the greentard about these things ‘saving the planet’; and being the ‘answer’ to ‘cataclysmic’ global warming (or ‘climate change’) require the suspension of our good friends – ‘logic’ and ‘reason’. To make it plain – wind power generation has NOTHING to do with the CLIMATE – one way or the other.
STT seeks to completely disconnect claims for and against global warming, and wind power generation (see our post here).
As laid out above – and in yesterday’s post – the simple FACT is that wind power can only ever be delivered (if at all) at crazy, random intervals.
It doesn’t matter how many turbines are planted – or how far apart they’re spread – wind power will NEVER amount to a meaningful power source. It will always require 100% of its capacity to be backed up 100% of the time with fossil fuel generation sources; in Australia, principally coal-fired plant. As a result, wind power generation will never “displace”, let alone “replace” fossil fuel generation sources.
Contrary to the anti-fossil fuel squad’s ranting, there isn’t a ‘choice’ between wind power and fossil fuel power generation: there’s a ‘choice’ between wind power (with fossil fuel powered back-up equal to 100% of its capacity) and relying on wind power alone. If you’re ready to ‘pick’ the latter, expect to be sitting freezing (or boiling) in the dark more than 60% of the time.
Wind power isn’t a ‘system’, it’s ‘chaos’ – the pictures tell the story.
So, next time you’re arguing the toss about the ‘wonders’ of wind – be it on the comments pages of a news site, blog forum or the like – why not plop in a link to this post (and yesterday’s for equal measure) and allow the intellectually challenged to grapple with the facts that turn their childish myths and fantasies to ashes.


Of course, the solution is staring everyone in the face: Liquid Fluoride Thorium Reactors! And with Australia having something like 18% of the world’s known supplies, and with these reactors able to reuse the present nuclear waste as fuel, isn’t it time to get into this now. Check this short and entertaining video by way of an introduction: https://www.youtube.com/watch?v=IZf6e0ntFrw.
The investors in the wind (farce) cannot say they haven’t been warned.
But the corrupted politicians take the big wind kickbacks whilst knowing it is a flawed technology with overblown energy capacity and output claims, and hideous acoustic impacts for unlucky neighbours.
Without political support this corrupt industry would disappear. Time for those ethical politicians who have been silent to date to stand up and confront the wind industry fraud and their unethical colleagues head on.
Thank you to the good senators who are confronting the industry lies, through the senate inquiry. Only a Royal Commission will hold the criminal conduct associated with this industry to account.
Great White Shark, when you’re done terrorising Mick Fanning, why not give politicians a scare by sending all of them links to the last 2 posts? Ask them for a response as to how on earth they can still support such an abject failure? And ask them why we are being lined up to transfer $45 billion in subsidies to support the fiasco?
Again well done STT. Can there be any reason for people to still try and put a case for wind energy as a rational replacement for other energy sources.
The rush to promote wind energy has resulted in a mess which Governments can no longer accept, a mess which has the potential to ensure Australia becomes a ‘basket case’ and loses the right to be called a modern society. If Governments don’t get their act together and begin to ready their States and the country to meet our energy needs in a manner which accepts all sources, but with the main source being reliable 24 hours a day as needed, then we are a lost cause.
There is no reason we cannot as individuals and businesses do our bit for the environment by installing solar panels and using less energy, but we also need a source that is compatible with industry and commercial needs, rational thinkers know this – but there are too many who imagine they are rational thinkers but are chaotic thinkers unable to see beyond the dust blowing up by turbines.