
****
In today’s post we lay out the wind power fraud in pictures, as it’s perpetrated in, what’s referred to as, ‘Australia’s wind power capital’, South Australia (we expand the net to capture the debacle on the entire Eastern Grid – see our post here).
To call the ‘performance’ of SA’s 17 wind farms (spread over a vast area of the State – with an installed capacity of 1,477MW) over the last few months “diabolical” is to flatter them.
SA’s Labor government has been talking up a wind powered future for months now – it’s presiding over the worst unemployment in the Nation, at 8.2% and rising fast – and seems to thinks the answer is out there somewhere – ‘blowin’ in the wind’. Its wind power debacle has led to South Australians paying the highest power costs in the Nation – if not (on a purchasing power parity basis) the highest in the world – and, yet, the dimwits that run it wonder why it’s an economic train wreck (see our posts here and here).
Well, today, STT – always ready to rain on the wind industry’s parade – as well as the gullible and corrupt that cheer it on – spells it out in pictures – that even the most intellectually interrupted should be able to grasp.
The derisory data that follows comes courtesy of Aneroid Energy. We’ll start with a quick look at SA’s monthly performance (oh, and if the graphs appear fuzzy, click on them and they’ll pop up crystal clear in a new window).
Looking a bit like the meanderings of a drunken spider that had dipped one leg in the ink-well and staggered over the page, that’s the nonsense that wind farms can deliver power as an “alternative” to on-demand power generation sources such as hydro, gas and coal belted, yet again.
With 31 ‘chances’ to make a meaningful contribution to lighting up the hundreds of thousands of homes said by wind power outfits to be ‘powered’ by their wind farms in SA – output collapses 13 times to less than 100MW – or less than 6.8% of the total installed capacity of 1,477MW.
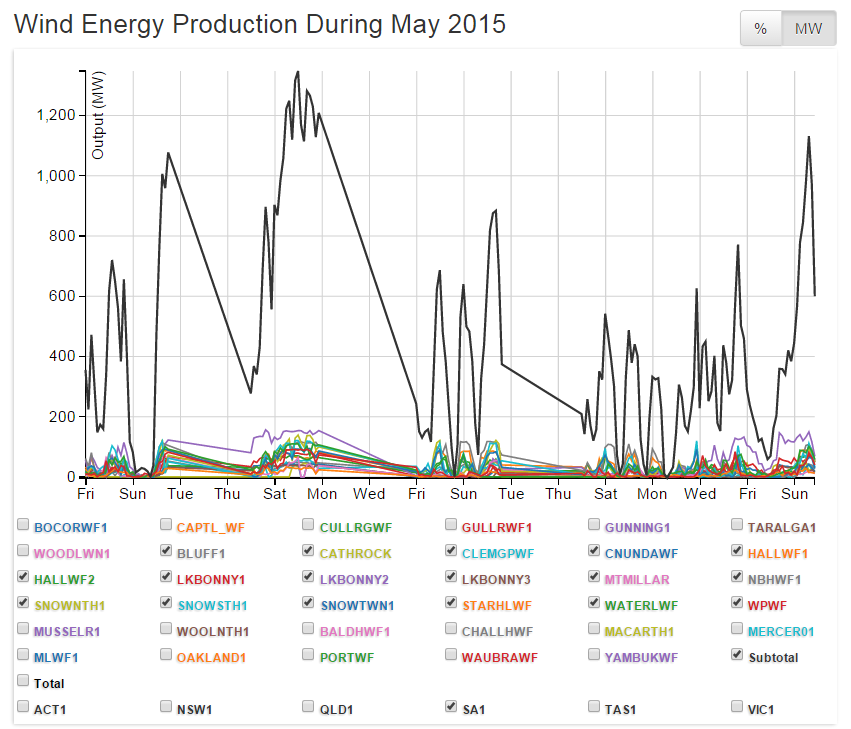
Here’s the total output from all wind farms in SA for June 2015.
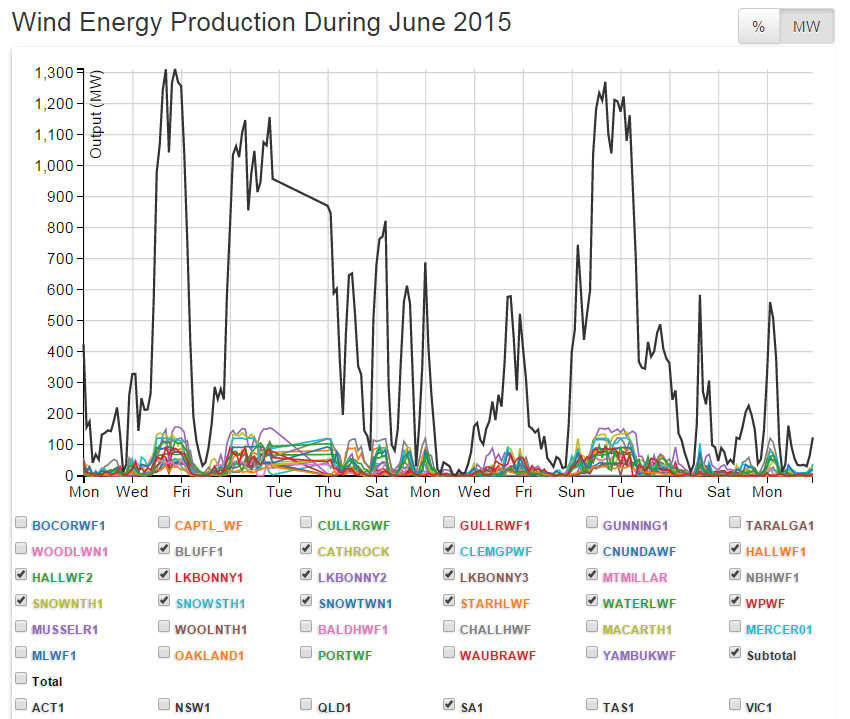
Having hardly lit up the screen for much of May, you’d think that June would see a better effort – but, oh no. Total output spends more time below 200MW (or 13% of installed capacity) than above. And hits the bottom of the pool more than 7 times – with ‘output’ failing to power a single kettle – let alone the hundreds of thousands of SA homes we’re constantly told are ‘powered’ by the wind.
Here’s the total output from all wind farms in SA for the start of July 2015.
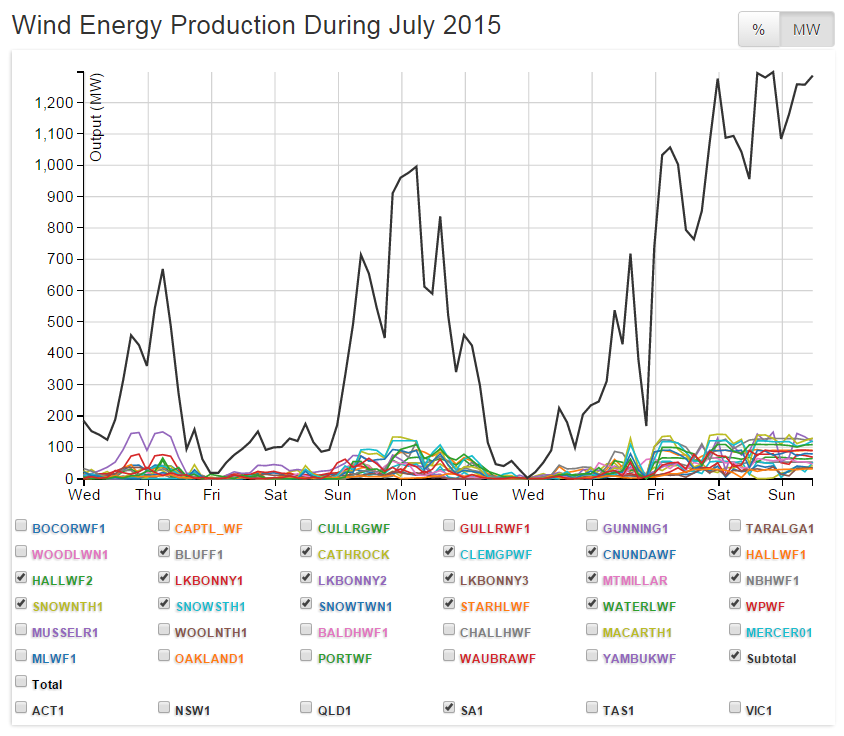
Looking more like the fat bloke bouncing around in the deep-end of the local pool, after a long lunch, July’s effort (so far) isn’t much better than the months before.
A couple of short-lived ‘spurts aside, and the rest is largely a ‘joke’: crashing by around 1,000 MW over 24 hours; and almost repeating the ‘performance’ a few days later with a precipitous plummet of over 500 MW in a couple of hours – makes it pretty clear that the words ‘reliable’ and ‘wind power’ don’t belong on the same page, let alone in a sensible sentence.
Spending days struggling to produce 200MW; hours and hours producing less than half that (or less than 6.7% of capacity); and 50MW (3.38%) or less for hours at a stretch, tends to take the gloss off the glory heaped on SA’s wind power dream; and suggests its future will be more of an energy nightmare.
Having taken a ‘helicopter view’, we’ll zoom in now – for a closer look at some of the more outlandish results on: May 3, 16, 25 and 26; June 12, 13, 14, 16, 17, 20, 29 and 30; July 2, 3 and 7.
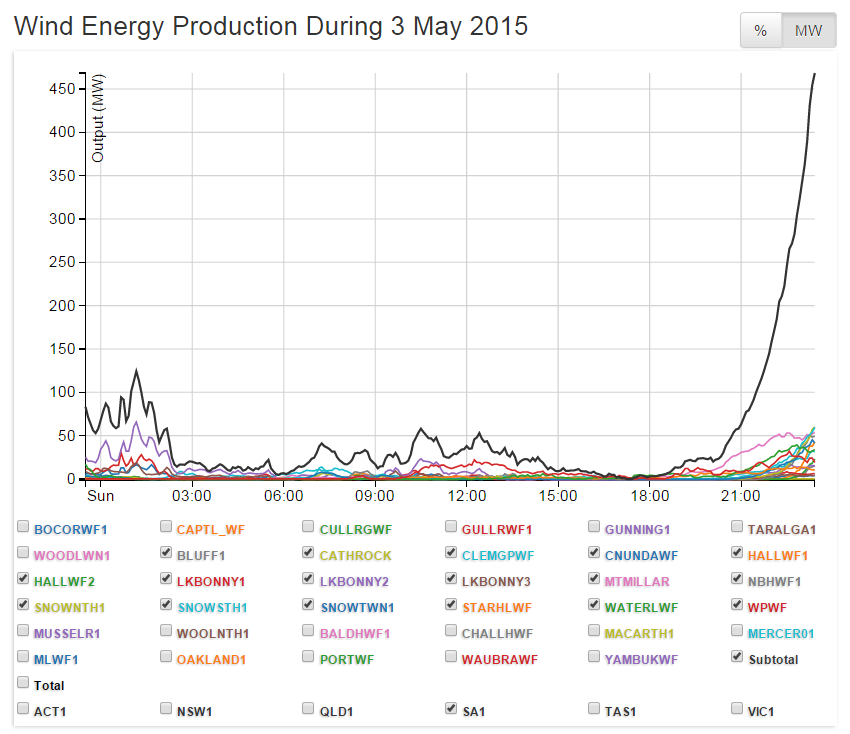
Entire SA Grid – 3 May 2015 – from midnight to 9pm (21hrs):
Total wind farm output: midnight to 9pm – never more than 100MW; from 3am to 8pm (17hrs) – never much more than 50MW; and during the same period collapsing to ZERO around 6am, and 5pm to 6pm.
Output as a percentage of total installed wind farm capacity: midnight to 2 am – 3.4%; 7am to 2pm – 1.7%; 2am to 9pm – 3.38%; 6am and 5pm to 6pm – ZERO%.

Entire SA Grid – 16 May 2015 – from 1am to 12.30pm – a total collapse of 720MW to ZERO:
Total wind farm output: 11.30am to 5pm (5.5hrs) – never more than 100MW; collapsing to ZERO from 12.30pm to 2pm (1.5hrs).
Output as a percentage of total installed wind farm capacity: 11.30am to 5pm (5.5hrs) – never more than 6.8%; collapsing to ZERO% – from 12.30pm to 2pm (1.5hrs).

Entire SA Grid – 25 May 2015 – from 8am to noon – a collapse of 325MW to ZERO – a 100% drop in output, in around 4hrs.
Total output: from 11am to 9pm (10hrs) – never more than 50MW; from noon to 4pm (4hrs) – ZERO.
Output as a percentage of total installed wind farm capacity: 11am to 9pm – less than 3.85%; from noon to 4pm – ZERO%.
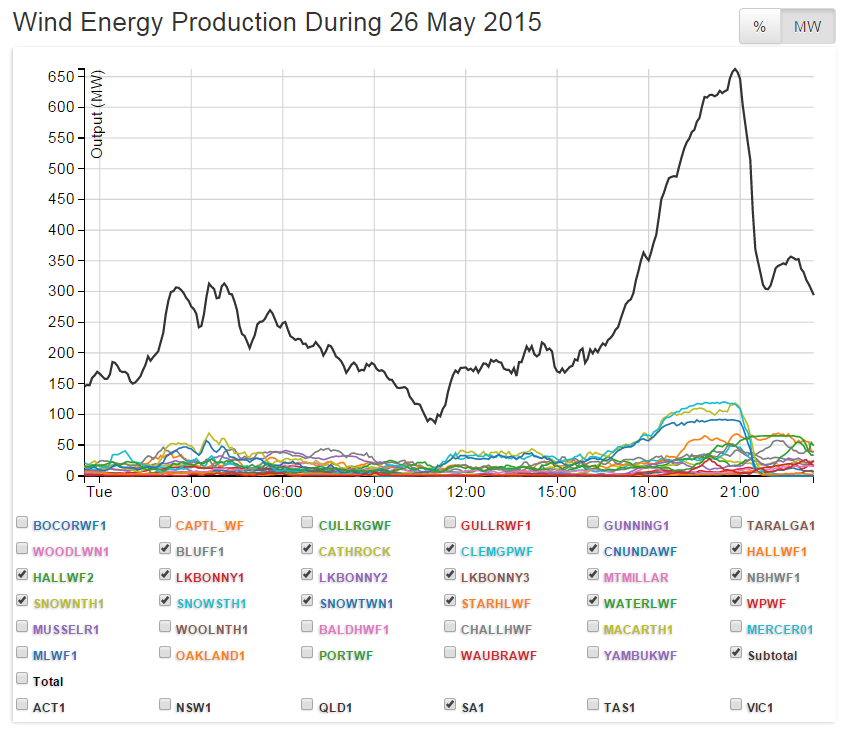
Entire SA Grid – 26 May 2015 – from midnight to 6pm (18hrs):
Total wind farm output: from midnight to 6pm – never much more than 350MW; from midnight to 2am 150MW; from 8am to 4pm – never more than 200MW; and falling to 90MW at 11am.
Output as a percentage of total installed wind farm capacity: from midnight to 2am – 10%; 8am to 4pm – never more than 13.5%; and dropping to 6.1% – at 11am.
Now for a closer look at June 2015.
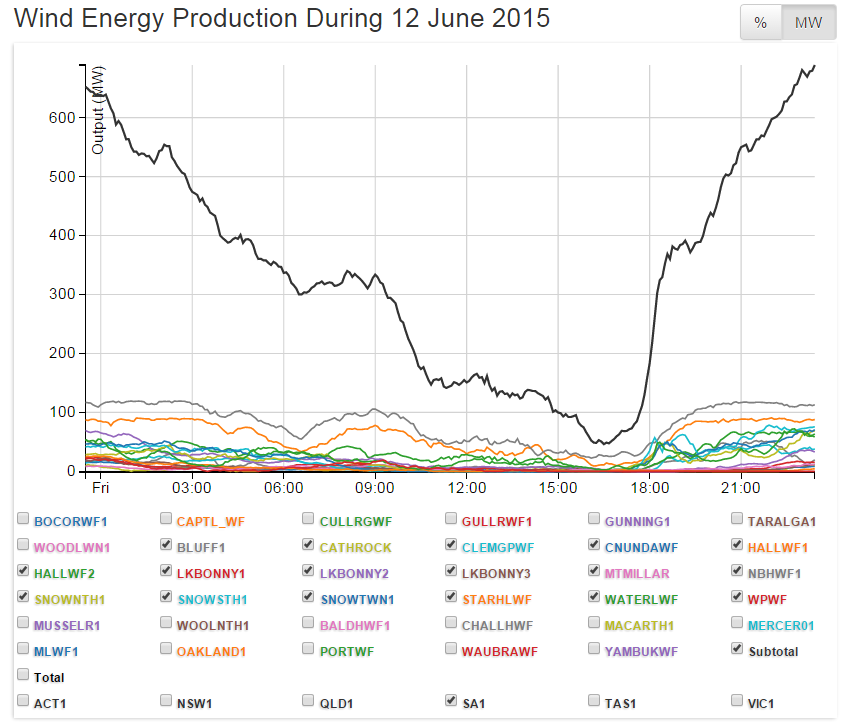
Entire SA Grid – 12 June 2015 – from midnight to 4pm a collapse of over 600MW:
Total wind farm output: 10am to 6pm – less than 150MW; 3pm to 5pm – dropping to 50MW.
Output as a percentage of total installed wind farm capacity: 10am to 6pm – 10%; and 3pm to 5pm – dropping to 3.85%.

Entire SA Grid – 13 June 2015 – from 9am to 3pm – a collapse of 750MW – 800MW to 50MW – or an output drop of 94% – at a rate of 125MW/hour:
Total wind farm output: from 2pm to 8pm – never much more than 100 MW; from 3pm to 5pm – around 50MW.
Output as a percentage of total installed wind farm capacity: 2pm to 8pm – between 6.8% and 10%; 3pm to 5pm – around 3.85%.
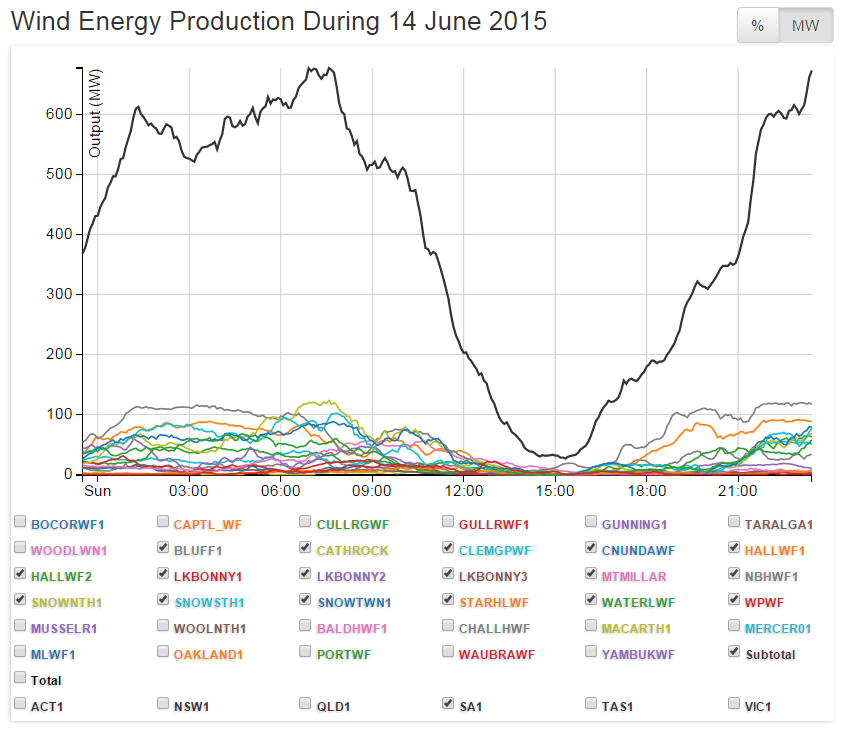
Entire SA Grid – 14 June 2015 – from 8am to 3pm – a collapse of over 650MW – from 700MW to 30MW – or a 96% drop in output:
Total wind farm output: from 1pm to 4pm (3hrs) – less than 100MW – dropping to 30MW.
Output as a percentage of total installed wind farm capacity: 1pm to 4pm – less than 6.8% – dropping to 2.03%.
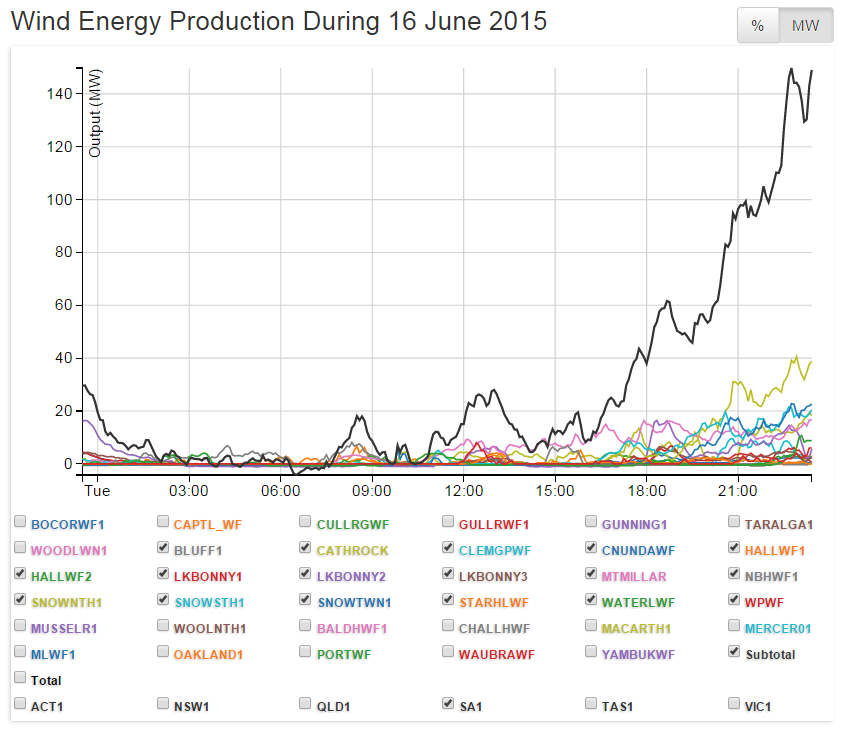
Entire SA Grid – 16 June 2015 – 24 hours – never more than 140MW:
Total wind farm output: from midnight to 5pm (17hrs) – less than 30 MW; from 3am to 7am (4hrs) – ZERO; falling to ZERO between 9am and 11am.
Output as a percentage of total installed wind farm capacity: never more than 10% for the entire 24 hour period; midnight to 5pm – less than 2%; with ZERO% produced for around 5hrs.
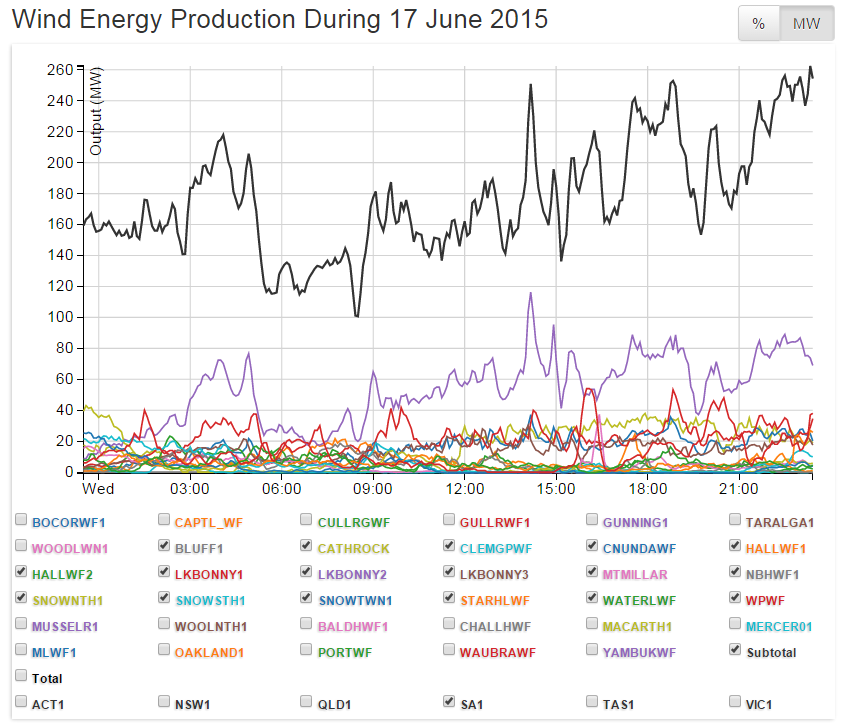
Entire SA Grid – 17 June 2015 – 24 hours – never more than 260MW – or 17.6% of capacity:
Total wind farm output: from 5am to 8am – less than 140MW; dropping to 100MW at 8.30am.
Output as a percentage of total installed wind farm capacity: never more than 17.6%; 5am to 8am less than 9.4%; falling to 6.8%.

Entire SA Grid – 20 June 2015 – from midnight to 6pm (18hrs) – never more than 70MW:
Total wind farm output: from midnight to 6pm – less than 70MW; 3am to 6am (3hrs) – around 25MW; from 1pm to 6pm (5hrs) – 25MW; falling to 10MW – around 4pm.
Output as a percentage of total installed wind farm capacity: midnight to 5pm – less than 4.7%; 3am to 6am – 1.7%; 1pm – 6pm – 1.7%, falling to 0.7% – at 4pm.
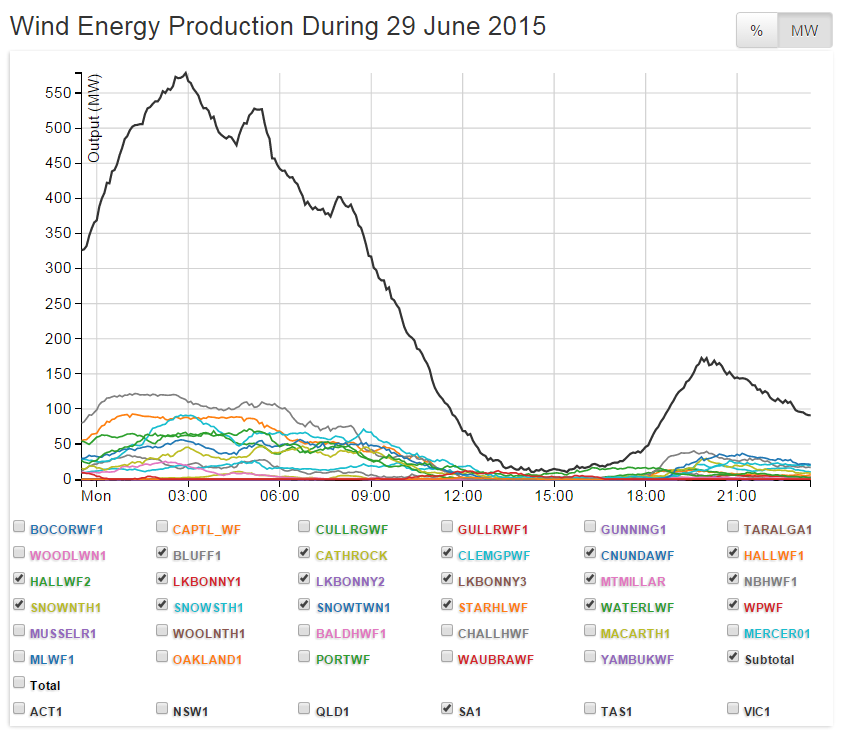
Entire SA Grid – 29 June 2015 – from 3am to 1pm – an almost total collapse of 550MW to 10MW – or a 98% drop in output:
Total wind farm output: from 1pm to 5pm (4hrs) – never more than 10MW; from 6pm to midnight (6hrs) – 50MW – briefly rising to 170MW and dropping to 90MW.
Output as a percentage of total installed wind farm capacity: from 1pm to 5pm – 0.7%; 6pm to midnight – 3.3% – briefly rising to 11% – dropping back 6.1%.
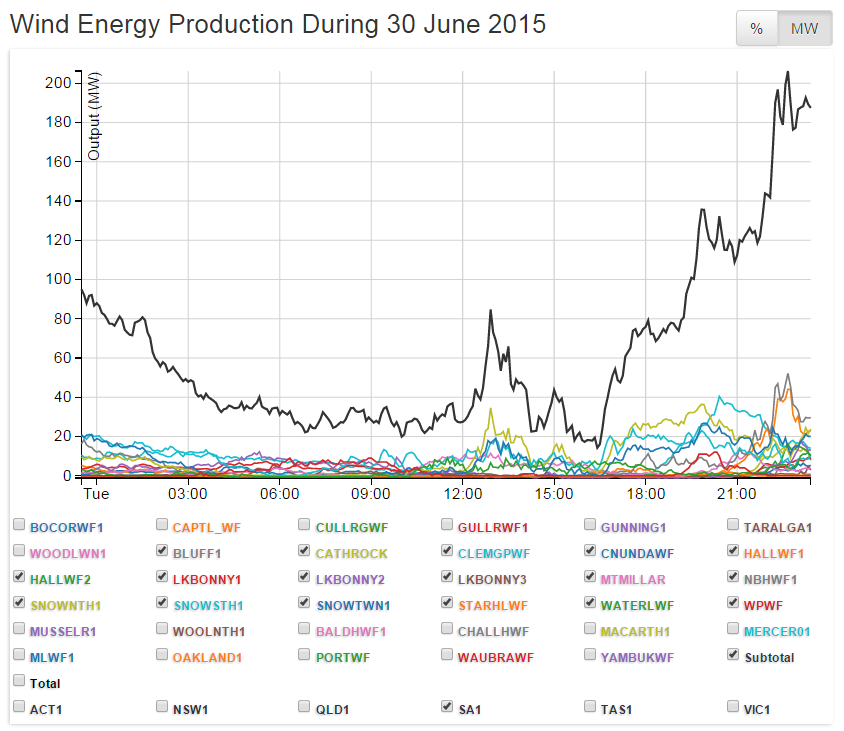
Entire SA Grid – 30 June 2015 – for the 24 hour period – never more than 200MW:
Total wind farm output: from 1am to 7pm (18hrs) – never more than 80MW; from around 3am to around noon – less than than 40MW and closer to 20MW for that period; falling to less than 20MW around 4pm.
Output as a percentage of total installed wind farm capacity: 1am to 7pm (6hrs) – never more than 5.4%; from around 3am to around noon (9hrs) – less than than 2.7% and closer to 1.3% for that period; falling to less than 1.3% around 4pm.
Now a look at the scoreboard for July, so far.
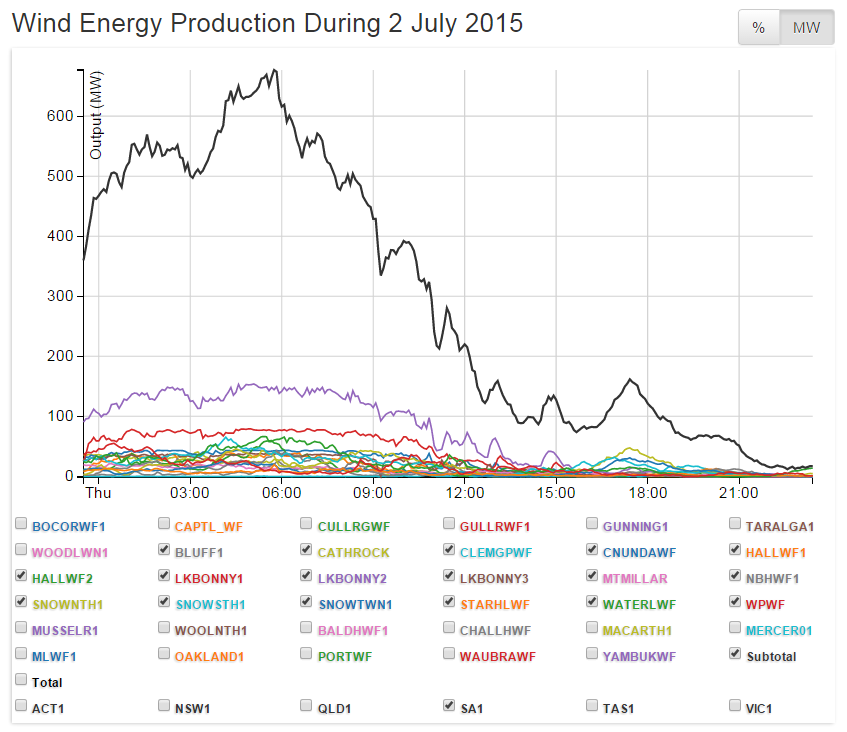
Entire SA Grid – 2 July 2015 – a total collapse of output over the period – 700MW to around 10MW:
Total wind farm output: from noon to midnight (12hrs) – never more than 150MW; generally around 100MW – falling to 10MW around 10pm to midnight.
Output as a percentage of total installed wind farm capacity: from noon to midnight (12hrs) – never more than 10%MW; generally around 6.8% – falling to 0.7% around 10pm to midnight.
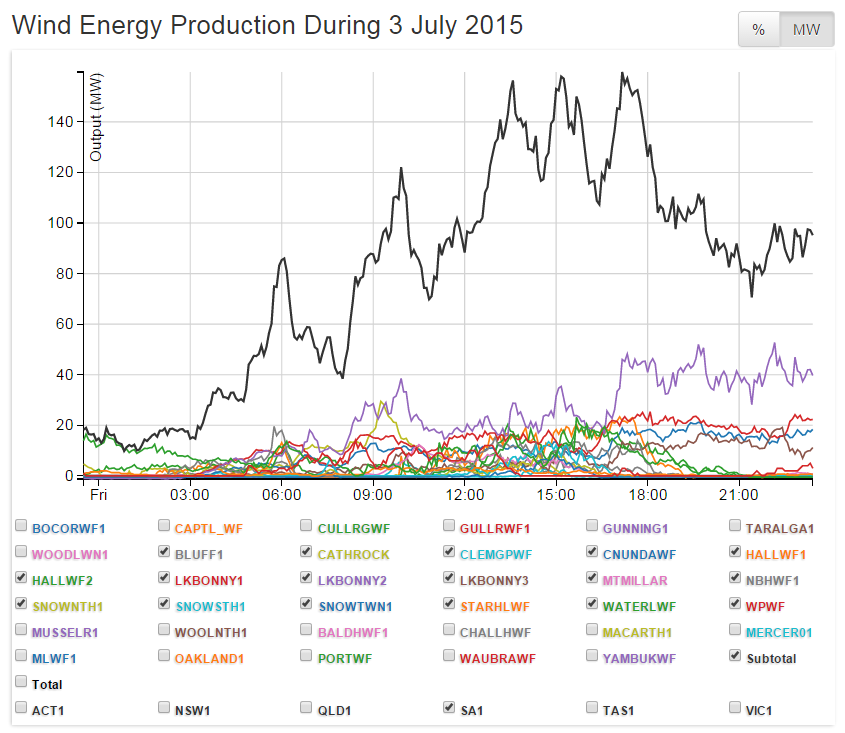
Entire SA Grid – 3 July 2015 – for the 24 hour period – never more than 150MW:
Total wind farm output: from midnight to 3am (3hrs) – never more than 20MW; twice falling to around 10MW; short burst to reach 80MW by 6am; dropping back to 40MW by 8am; with peaks and troughs later in the day – before dropping back to less than 100MW – 7pm to midnight.
Output as a percentage of total installed wind farm capacity: never more than 11% for the 24 hour period; much of it producing less than 6% – and often less than 2%.
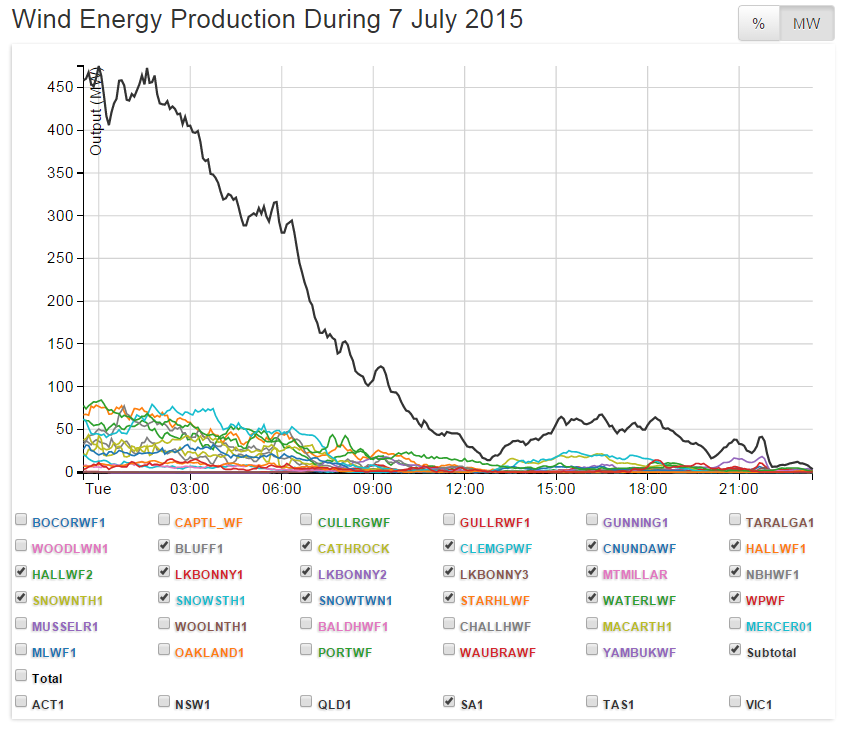
Entire SA Grid – 7 July 2015 – from 2am to 1pm – a collapse (almost total) of 450MW – from 470MW to 20MW – or a 97% drop in output:
Total wind farm output: from 10am to midnight (14hrs) – never more than 60MW; twice falling to less than 20MW; and to ZERO around 10pm to midnight.
Output as a percentage of total installed wind farm capacity: from 10am to midnight (14hrs) – never more than 4.1%; twice falling to less than 1.3%; and to ZERO% – around 10pm to midnight.
We’re bored now – we’ve made our point: the idea that SA (or anywhere else for that matter) can ditch fossil fuel power generation sources and – by relying on wind power – go ‘100% renewable’ is pure fantasy.
Anyone who – after perusing the pitiful pictorial above – tries to tell you otherwise is probably not playing with the full deck. Either that, or they’ve got their trotters firmly planted in the wind power fraud trough.
At STT we love scorching wind power myths – and all the more so when it can be done with pictures.
In the last few months the lunatics from the fringes of the Labor party – and other hard-green-left nutjobs – have ramped up their rhetoric – pressing all and sundry join in their ultimate mission to go “fossil free” – they mean abstaining from the use of “fossil fuel”, rather than ceasing to rely on T-Rex and his – now stony/boney – kin. Although they have no apparent hesitation when it comes to burning up millions of litres of kerosene, flying to groovy backpacker must-sees, and “climate change” jamborees, all over the globe (see our post here).
Contrary to the anti-fossil fuel squad’s ranting, there isn’t a ‘choice’ between wind power and fossil fuel power generation: there’s a ‘choice’ between wind power (with fossil fuel powered back-up equal to 100% of its capacity) and relying on wind power alone. If you’re ready to ‘pick’ the latter, expect to be sitting freezing (or boiling) in the dark more than 60% of the time.
Wind power isn’t a ‘system’, it’s ‘chaos’ – the pictures tell the story.
One thing that amuses the STT gang, is seeing links to our posts appearing on the comments pages of online news sites, blog forums and the like: often they’re dropped into a ‘debate’ about the ‘wonders of wind’, with an apparently gleeful ‘splat’ – in a ‘get around that, and play fair’ kind of moment – that usually pulls the ‘debate’ to a shuddering halt.
STT predicts that this is going to be one such post.
So, next time you find yourself dealing with the intellectual pygmies, that are still clinging to their wind power myths and fantasies, why not flick them a link to this post – or have a little fun with an STT ‘splat moment’, on their favourite blogs and news sites?
Why not pitch a few sitters along with it, such as: on 3 May; after lunch on 25 May; after lunch on 13 June; on 16 June; on 20 June; and after lunch on 7 July:
How many South Australian homes (not kettles) were actually being powered by ‘wonderful wind’?
Where did all the power come from that kept the lights on and got the kettles boiling?
Was it coal? Was it gas? Or a bit of both?
In the light of your last answer, how much ‘dreaded’ CO2 gas was saved by SA’s 17 wind farms?
And what effect did wind power have on power prices in SA’s wholesale market for electricity?
We don’t expect them to enjoy it; but wind power worshippers have never been that keen on the facts.


It’s actually worse that all your figures here show
As each wind turbine…. when not in use requires power from the grid… eg they are parasitic
So either the batteries they just charged up… or the grid… has to keep them powered when they are not used.
Excellent…. wind blows and they charge up batteries…. wind stops… they use the charged batteries.
It’s a good system
I do not understand: the graphs are titled “wind energy production” and the unit on the vertical axis is MegaWatt, a unit of power.
On the bottom axis, you might notice time as 24 hour increments, aka ‘days’. MW over time equals the total generation over time ie MWh
Thank you STT, so often the industry and its cronies come out cheering when these things manage to produce 100% of renewable energy for a desperately short period. These periods seemingly to occur during summer when roof top solar and wind are combined, to produce these times of their joy. However, those supporting the wind industry really must be careful, because if their tears freeze they could be left with ice burns on their faces and they wouldn’t like people to think the red was from embarrassment would they!
Those graphs are enlightening and should be showcased more often around the world. But I’d like to see less snarky climate denier attitudes on this site. Plenty of us despise turbine-pushers AND global warming deniers. The real issue is hubris and stupidity. The shortcomings of wind energy don’t change the laws of thermodynamics as they relate to CO2. Man is capable of making a mess in more than one realm, and the tendency to fall back on “us against them” distracts from critical thinking.
OK hotshot, what’s your solution to set an ever changing climate in ‘Goldilocks’ mode for eternity? We’re all ears.
This hotshot thinks that attitude is exactly why SourceWatch lists STT as a disinformation group. It’s natural for them to snub climate deniers, even though “landscape change denial” is a serious issue. Having a respectable public image is what will really stop the wind ruse.
You casually mention an “ever changing climate” which is a standard diversion from the evidence. One could rationalize today’s epic wildfires as “ever changing forest-cover” and pretend lightning and volcanoes are still the only factors. Long before AGW, Man was committing arson and setting reckless campfires. But we are raising CO2 levels this time around and it doesn’t matter what caused it in the past. Nature alone could ride it out but all this infrastructure was never at stake.
The best we can probably do is slow warming a bit by wasting less oil, gas & coal, which is intelligent since they’re finite and irreplaceable. It makes no sense to squander one-time gifts from millions of years ago under any scenario I can think of. Gluttony is a loutish goal, just like destroying rural scenery for profit.
Ok, so no ‘solution’ then?
Before you settle on what STT’s actual position is (based on some Ministry of Truth like ratings agency) you might read this post and form your own view, possibly?
Didn’t see any mention of nuclear power in your diatribe. So you’re not really interested in CO2 emissions in the electricity sector then?
Although we did note you want us to stop using fossil fuels (although you define it as ‘wasting’ oil, gas etc). Is it over to you to decide on what amounts to ‘waste’? That kind of waste wouldn’t be you driving to the shops; driving to work; taking that flight to London? Would it? That wouldn’t be ‘gluttony’, that would be an appropriate allocation of scarce resources, would it not?
Of course, its everybody else’s car/flight/flat screen TV/hot shower/cold beer that is gluttony. Not yours.
In 2016, anyone serious about AGW is backing nuclear power. But not you?
SST, have you calculated any overall costs to output?
How many times as expensive as coal power is it, all factors considered?
Tony, here’s a recent post – see the linked article within it.
There are many other posts on the topic, search for ‘wind power costs’ and ‘PPA’ in the search window.
But, with respect, ‘cost’ and ‘price’ are not to the point: ‘value’ is the real question. The graphs above show that wind power has no commercial value – as does any power source that cannot be delivered on demand. The only reason retailers purchase wind power is to obtain RECs and avoid the shortfall penalty.
Hope that helps.
Fair go STT ! What has this got to do with important, relevant issues that sustain our nation, you know, like same sex marriage, transgender operations for kids, helicopter flights by Browyn Bishop, welfare for ice addicts, welfare for the CEFC, welfare for the Climate Change Authority, Simon Chapman’s pension and superannuation benefits, skiing holidays for the Clean Energy Regulator, increased medicare levies for the AMA to suck on etc.etc.
Unlikely this post will get sent around; the ‘pictures’ are a bit complicated, but nice try; and no doubt the ‘clean energy council’ will be able to explain them to Senator Urqhuart on the Senate Enquiry as just ‘another cartoon’.
Remember the song from ‘Paint your wagon’…….
“And they called the wind Maria”…….
“Maria blows the stars around
And sets the clouds a-flyin’
Maria makes the mountains sound
Like folks was out there dyin'”
How about we call the wind “MIA” for short…..
stands for…………… Missing In Action
which pretty well sums up the wind power contribution to the grid whenever there is a High sitting over South Eastern Australia.
If you want to know about wind power? Ask any farmer who had a freelight in the time before we had the power connected. They can tell you exactly which months are calmest. And when the wind didn’t blow, they spent money on petrol or kerosene to run the generator.