
There’s something altogether pathetic about those that push wind and solar as the path to an energy Utopia. A place where unicorns, fairies and pixies are in charge and numbers get treated with contempt.
Numbers such as those collected by Frances Menton and Robert Bryce in the pieces below.
Numbers that demonstrate that, after almost 30 years of massive subsidies, punitive mandates and wildly ambitious targets, the total contribution made by wind and solar to world energy demand stands at little more than a rounding error. Whereas coal, oil, gas and nuclear continue to deliver the goods in a fast growing and increasingly energy hungry world.
This Energy Transition Thing Really Is Not Happening
Manhattan Contrarian
Francis Menton
25 June 2024
From reading the left-wing media, you know (or think you know) that there is an energy “transition” going on. This is something that must happen as a matter of urgent necessity. Vast government subsidies are being disbursed to assure its rapid success. Fossil fuels are rapidly on the way out, while wind and solar are quickly taking over.
For example, you may well have seen the big piece last August in the New York Times, headline “The Clean Energy Future Is Arriving Faster Than You Think.”
Across the country, a profound shift is taking place . . . . The nation that burned coal, oil and gas for more than a century to become the richest economy on the planet, as well as historically the most polluting, is rapidly shifting away from fossil fuels.
But if you read that piece, or any one of dozens of others from the Times or other “mainstream” sources, what you won’t find are meaningful statistics on the extent to which fossil fuel use is declining, if at all, or the extent to which renewables like wind and solar are actually replacing them.
That’s why the Manhattan Contrarian turns instead to dry statistical data to try to get the real story. Several years ago I discovered an annual book of energy data called the Statistical Review of World Energy. At the time, the Statistical Review was produced by the international oil company BP. I first covered one of these Reviews in this post from July 2019. A couple of years ago BP apparently decided to get out of this business, and turned the product over to something called the Energy Institute. EI then produced a Statistical Review in June 2023 (covering 2022), and now is just out on June 20, 2024 with a Statistical Review covering 2023.
Most of the Statistical Review consists of just spreadsheets of numbers. There are some charts, but relatively few. But the takeaways are too obvious to hide. The big one is this: there is no energy “transition” going on, at least not in the sense that “renewables” are actually supplanting fossil fuels. Yes there is some considerable amount of “renewable” wind and solar electricity generation getting built (with huge government subsidies). But it is not replacing fossil fuel generation. Rather, fossil fuel generation continues to increase, and its share of overall energy production has barely budged.
Here is EI’s June 20 Press Release, which summarizes the five “key stories” that it says emerge from the statistics. The first one is the big one — increasing energy consumption led by increased production and consumption of fossil fuels:
Record global energy consumption, with coal and oil pushing fossil fuels and their emissions to record levels. Global primary energy consumption overall was at a record absolute high, up 2% on the previous year to 620 Exajoules (EJ). Global fossil fuel consumption reached a record high, up 1.5% to 505 EJ (driven by coal up 1.6%, oil up 2% to above 100 million barrels for first time, while gas was flat). As a share of the overall mix they were at 81.5%, marginally down from 82% last year.
And of course, “emissions” continue to rise:
Emissions from energy increased by 2%, exceeding 40 gigatonnes of CO2 for the first time.
No matter how much the federal government or any state threatens to punish you for your sin of fossil fuel use, aggregate global emissions from such use are not going to go down within our lifetimes.
The second “key story” relates to the contribution, or lack thereof, of solar and wind. Here EI engages in some modest spinning to make things look less bad than they are for the solar and wind promoters; but there’s not much they can do:
Solar and wind push global renewable electricity generation to another record level. Renewable generation, excluding hydro, was up 13% to a record high of 4,748 TWh. This growth was driven almost entirely by wind and solar, and accounted for 74% of all net additional electricity generated.
4,748 TWh of renewable generation — wow, that’s a lot! Or is it? Do you notice how they suddenly switched units from Exajoules to Terawatt hours when they changed from talking about fossil fuels to solar and wind. Does anybody around here know the conversion factor? Yes — it’s 277.778 TWh per EJ. That means that the 4,748 TWh of “almost entirely” solar and wind power generated in 2023 came to all of 17.1 EJ, which is just 2.7% of the 620 EJ of world primary energy consumption. Could you have imagined that it could be so little, after decades of over-the-top promotion and trillions of dollars of subsidies?
And pay attention to that line “wind and solar . . . accounted for 74% of all net additional electricity generated.” Does that somehow sound like a transition is happening? It’s the opposite. If wind and solar were actually taking over, they would have to account for 100% of additional generation, plus large further amounts to replace fossil fuel generators. As long as wind and solar account for less than all of additional generation, then fossil fuels are continuing to increase, and there is no “transition” going on at all.
I mentioned that there were relatively few charts in the Review, but some of them are striking. Here is one of my favorites, showing global coal consumption from 1965 to 2023:
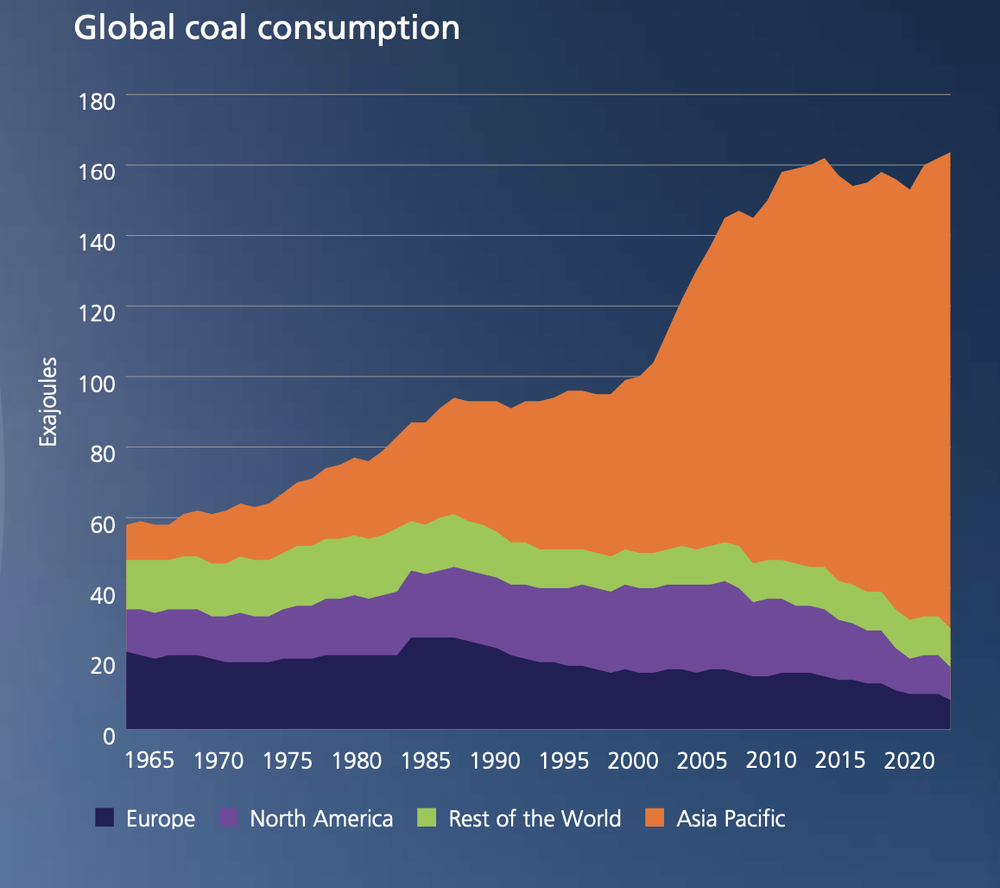
Over that period, North America and Europe have cut their consumption almost by half, from almost 40 EJ per year to around 20. But over the same period the consumption in the rest of the world has gone from about 20 EJ to around 140, multiplying by a factor of 7. And don’t be fooled by the apparent leveling off of increases in total consumption in the last several years. That reflects continuing decreases in North America and Europe, which are more than offset by larger increases in the Asia Pacific region.
Robert Bryce at his Substack has many more details from the EI Statistical Review, plus several charts that he has created from the EI data. He is much better at creating charts than I am. The title of Bryce’s article is “Numbers Don’t Lie.” Bryce also has a figure for the amount of government subsidies that have gone to wind and solar generation since 2004: $4.7 trillion. That much money to fund a supposed “transition” that isn’t occurring at all.
The story is going to be effectively the same every year until finally the promoters give up on the wind/solar scam.
Manhattan Contrarian
Numbers Don’t Lie
Robert Bryce
Substack
23 June 2024
These 9 charts from the Statistical Review Of World Energy expose the myth of the energy transition & show hydrocarbons are growing faster than alt-energy.
During his 16-year career in the NBA, Rasheed Wallace was among basketball’s most intimidating power forwards. He was also among the most volatile. Wallace holds the single-season record for technical fouls (41) and ranks third all-time in total technicals with 317.
In addition to his disdain for referees, the 6’11” Wallace, gained fame for a particular catchphrase. If “Sheed” or one of his teammates was called for a foul that he thought was undeserved, and the opposing player missed the ensuing free throw, he would often holler, “Ball don’t lie,” to indicate that the basketball knew the referee had made a bad call.
The ball don’t lie. Neither do the numbers in the latest Statistical Review of World Energy.
Amid the ongoing blizzard of propaganda about the “energy transition” and the tired antics of the goobers from Just Stop Oil — a pair of whom vandalized Stonehenge with orange paint last Wednesday — the Statistical Review, published by the Energy Institute, KPMG, and Kearney, provides a much-needed reality check to the narrative being promoted by major media outlets, academics, and the NGO-corporate-industrial-climate complex.
The new Statistical Review, released last Thursday, shows, yet again, that despite the hype, subsidies, and mandates, wind and solar energy aren’t keeping pace with the growth in hydrocarbons. Global hydrocarbon use and CO2 emissions hit record highs in 2023, with hydrocarbon consumption up 1.5% to 504 exajoules (EJ). That increase was “driven by coal, up 1.6%, [and] oil up 2% to above 100 million barrels [per day] for the first time.” Global natural gas demand was flat, mainly due to stunning declines in Europe. Gas demand in the U.K. fell by 10%. It also fell by 11% in Spain, 10% in Italy, and 11% in France.
Soaring electricity demand was, yet again, the big story in 2023. Global power generation increased by 2.5% to 29,924 terawatt-hours. About 32% of that juice (9,456 TWh) was generated in China, where electricity production surged by nearly 7%. The U.S. came in a distant second in power generated, with 4,494 TWh. Domestic power production dropped by about 1% last year. Power generation in India also increased by about 7% last year to a record 1,958 TWh, 75% of which came from coal-fired power plants.
I look forward to the release of the Statistical Review every year because the data can be downloaded in Excel. That allows me and others to make meaningful comparisons beyond the spin. Numerical comparisons are essential ingredients in the debate over energy and climate policy. The best advice I ever got on presenting numbers came from author and statistician Edward Tufte. He said: whenever you give people a number, give them a familiar metric so they can make a comparison. That advice changed the course of my career. Here are nine charts from the Statistical Review.
Chart 1
I published this chart last month in “What The Media Won’t Tell You About The Energy Transition.” I’ve updated it with the latest figures from Bloomberg New Energy Finance and the Statistical Review.
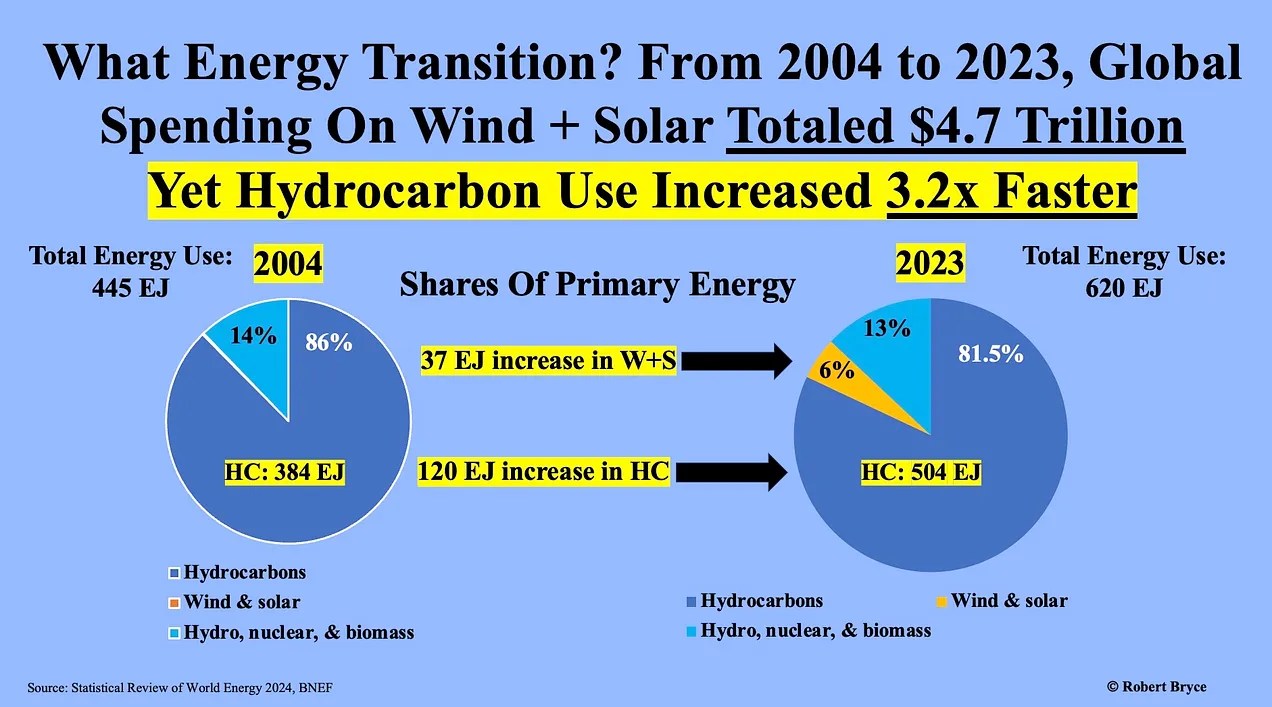
Chart 2
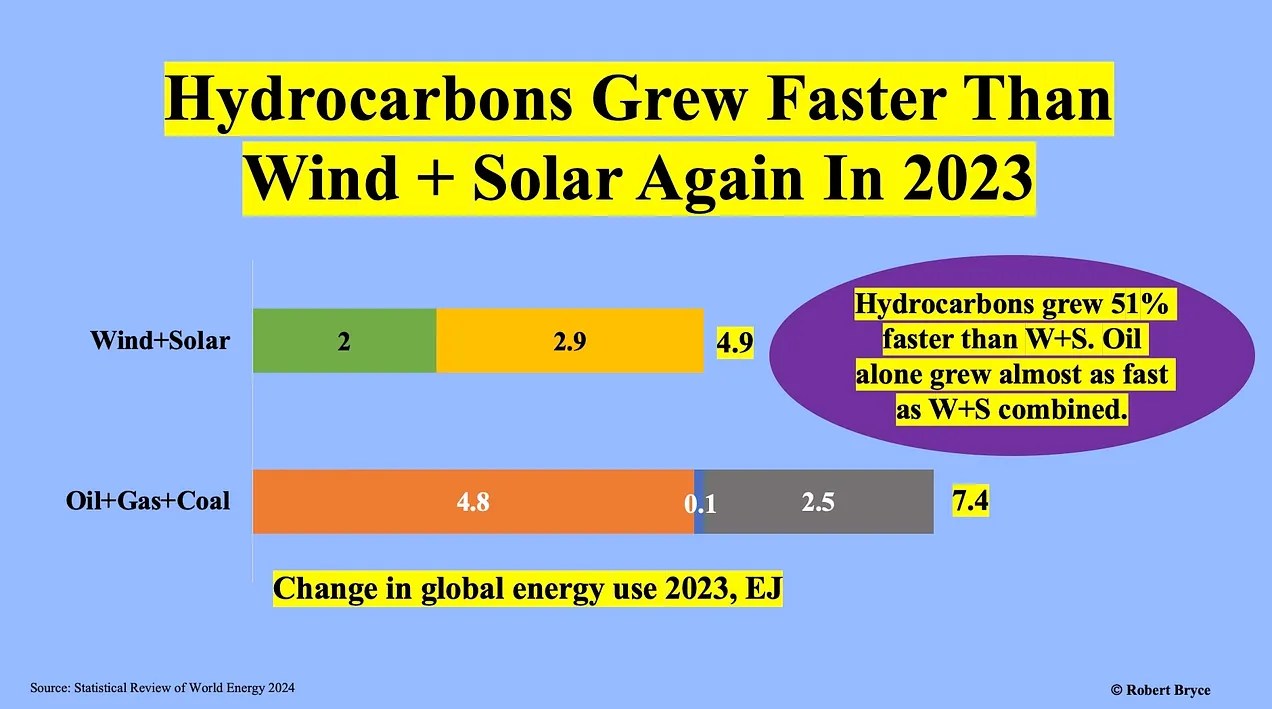
Chart 3
Chart 4
This graphic uses the same numbers as the one in the previous slide but has higher resolution because the numbers can be compared more easily. It clearly shows that the reductions in emissions in the West are being swamped by the massive increases in China and India.
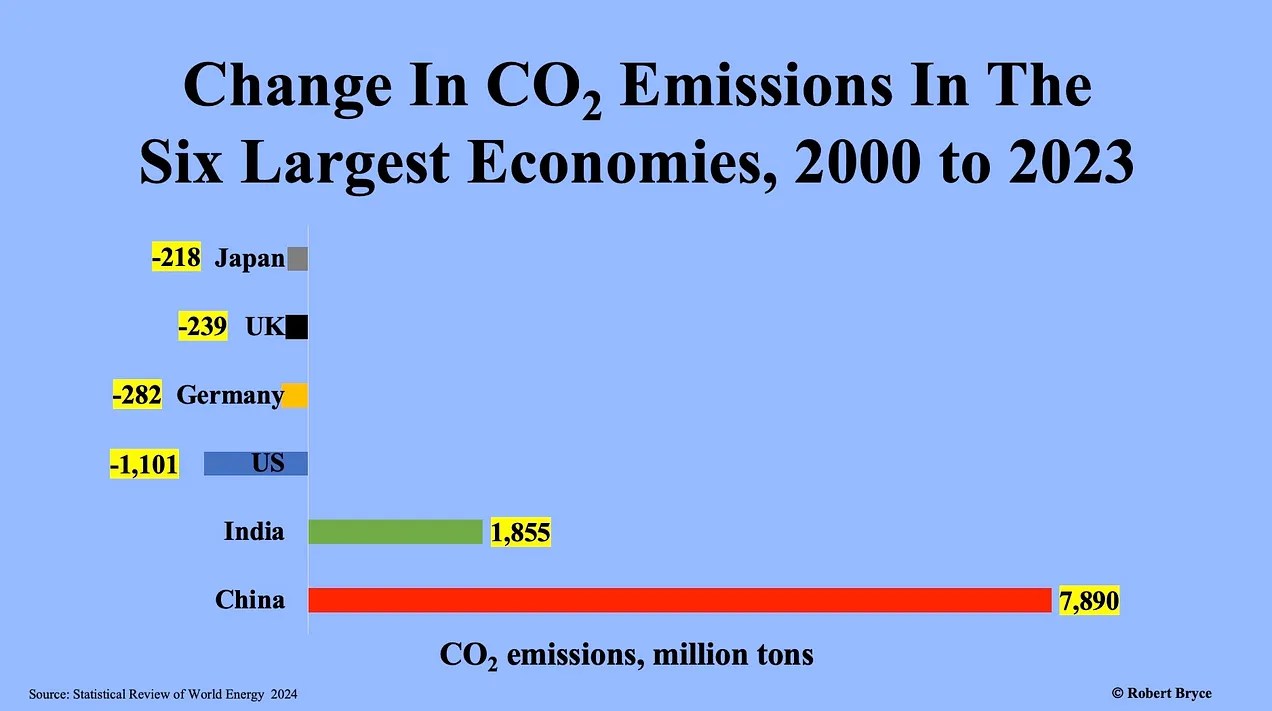
Chart 5
The U.S. again led the world in emissions reductions in 2023, but as shown in the previous two slides, those reductions are being swamped by the growth in India and China.
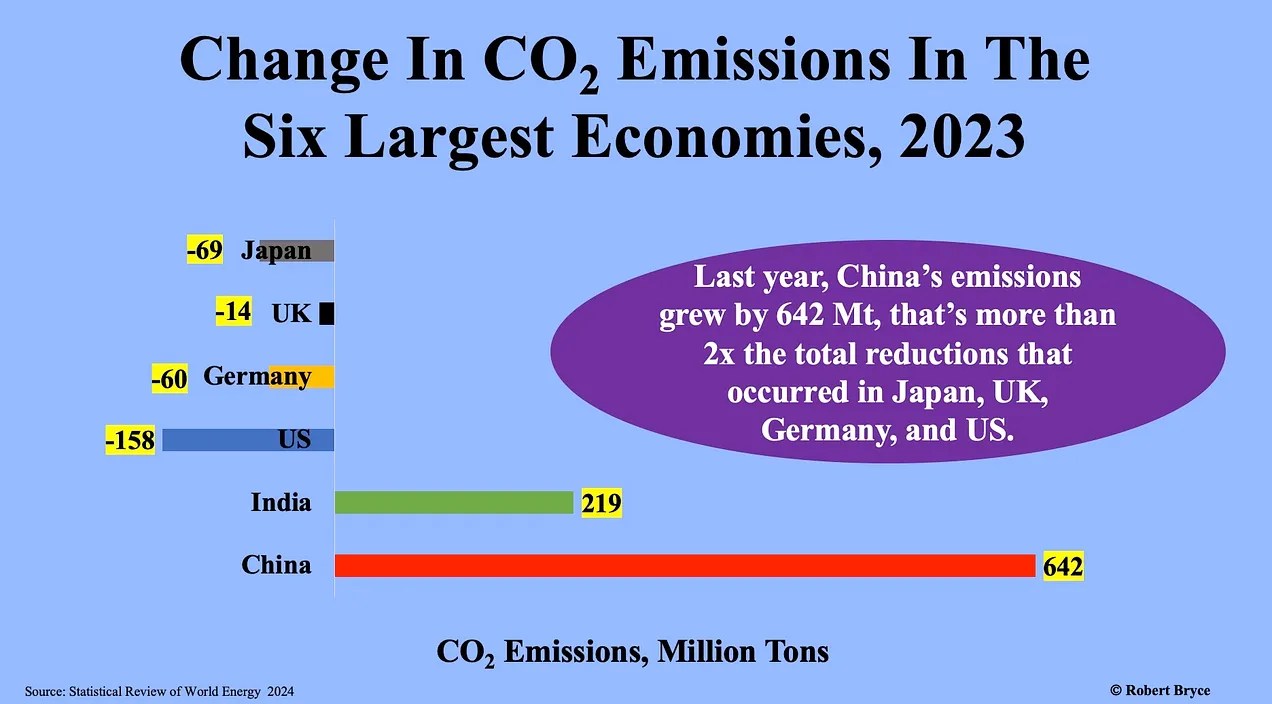
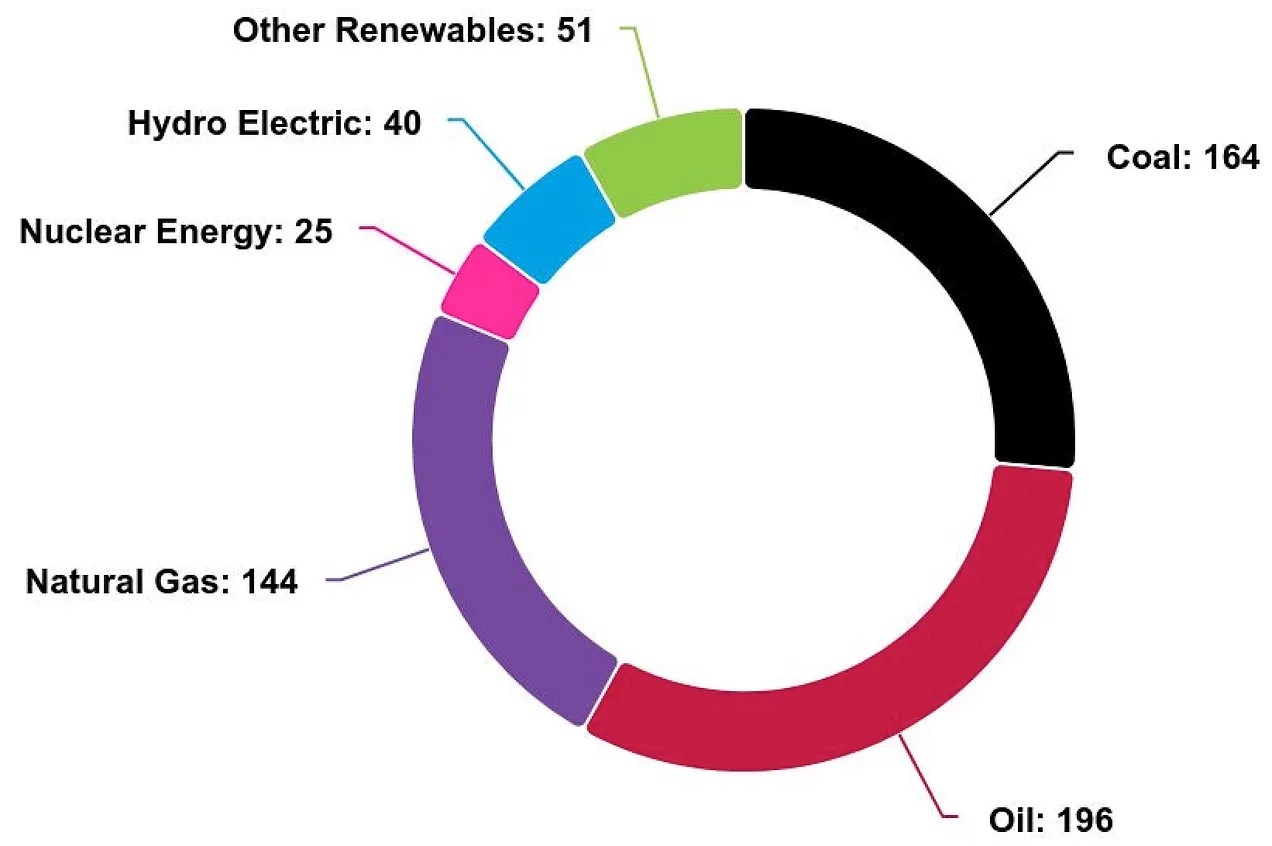
Chart 6
Climate activists can sling all the soup and paint they want, but oil remains the dominant form of energy consumed worldwide. Oil use increased slightly last year in the U.S., up about 0.5%. Meanwhile, consumption soared in China, up almost 11%. It was also up 5% in India and nearly 13% in Vietnam. The results: global demand jumped by about 2.3 million barrels per day, and oil use averaged over 100 million barrels per day for the first time in history.
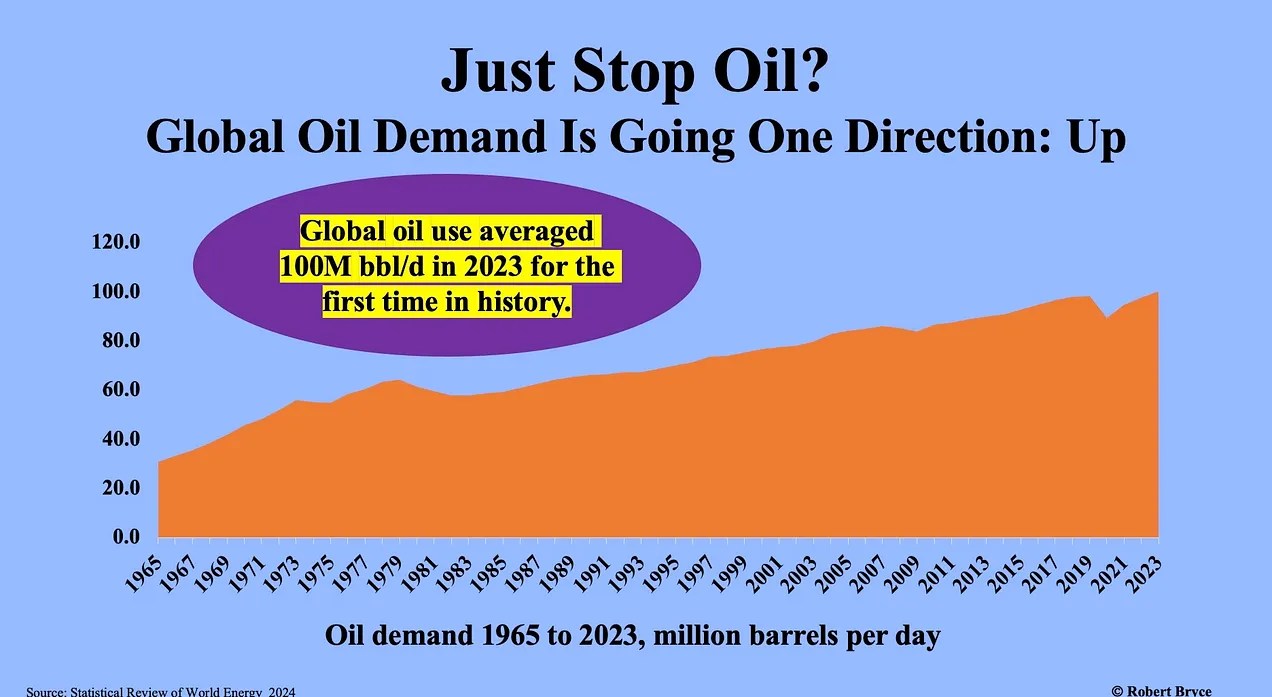
Chart 7
As I noted last December in “Two Days After COP28, IEA Delivers More Coal Hard Reality,” the International Energy Agency has been predicting a decline in global coal demand for years. I explained that in 2015, the IEA claimed, ‘The golden age of coal in China seems to be over.” That year, the agency predicted global coal demand would fall to 5.5 billion tons by 2020. That didn’t happen. Instead of falling, coal demand keeps powering upward, with major increases in China and India. Other Asian countries, including Vietnam, the Philippines, and Bangladesh, are also burning more coal.
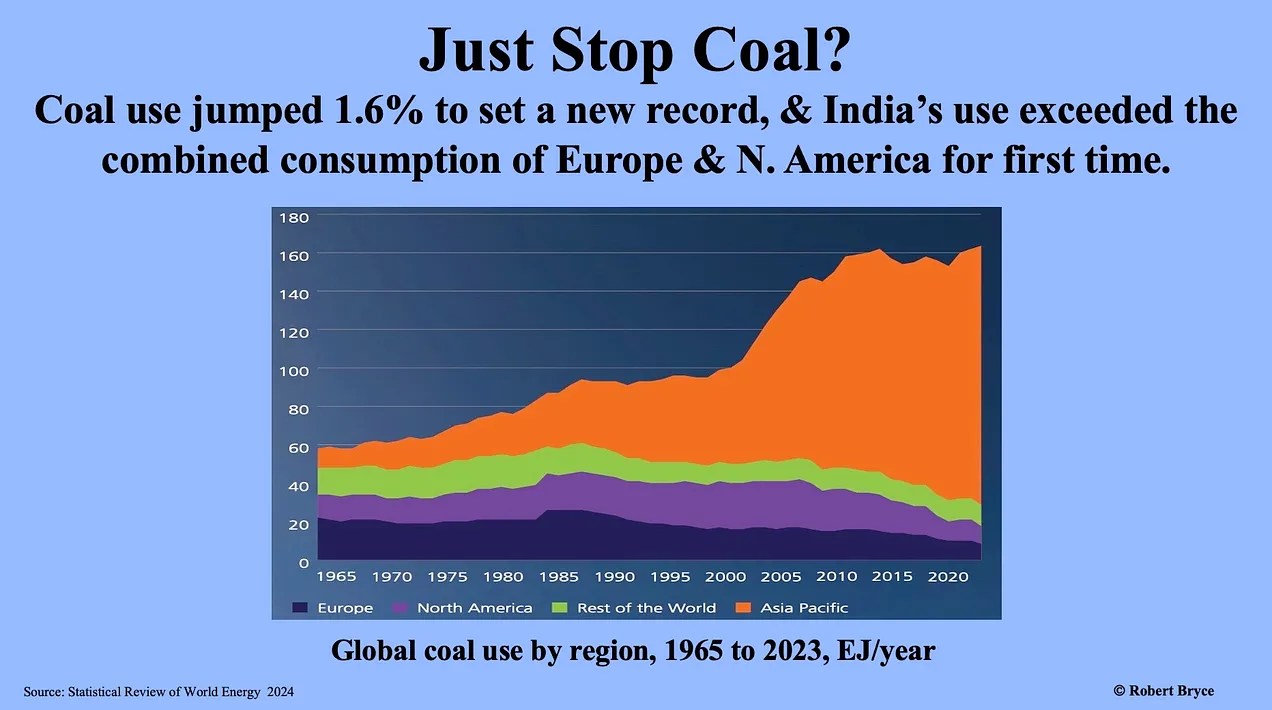
Chart 8
The Inflation Reduction Act provides tens of billions of dollars in subsidies for wind and solar in the U.S. However, as seen below, gas-fired generation is still growing faster than those two sources combined. Note that in 2023, wind generation fell despite the addition of 6 gigawatts of capacity. Why? The wind didn’t blow.
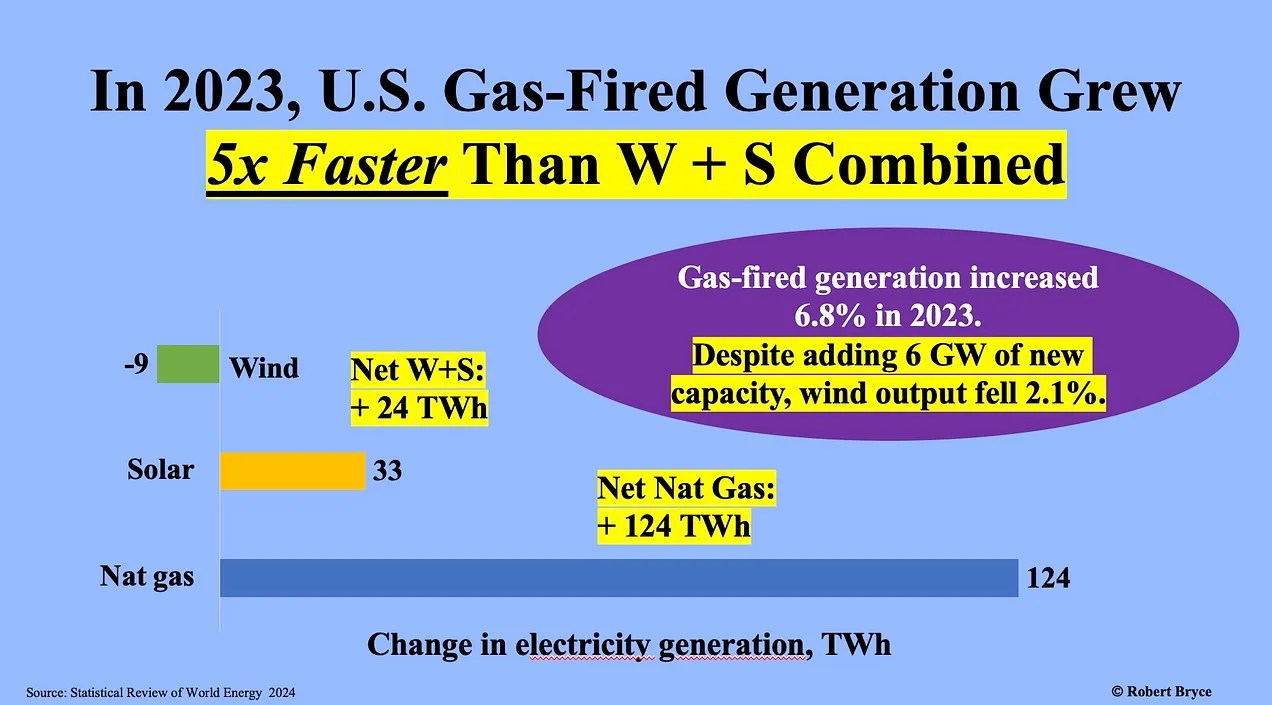
Chart 9
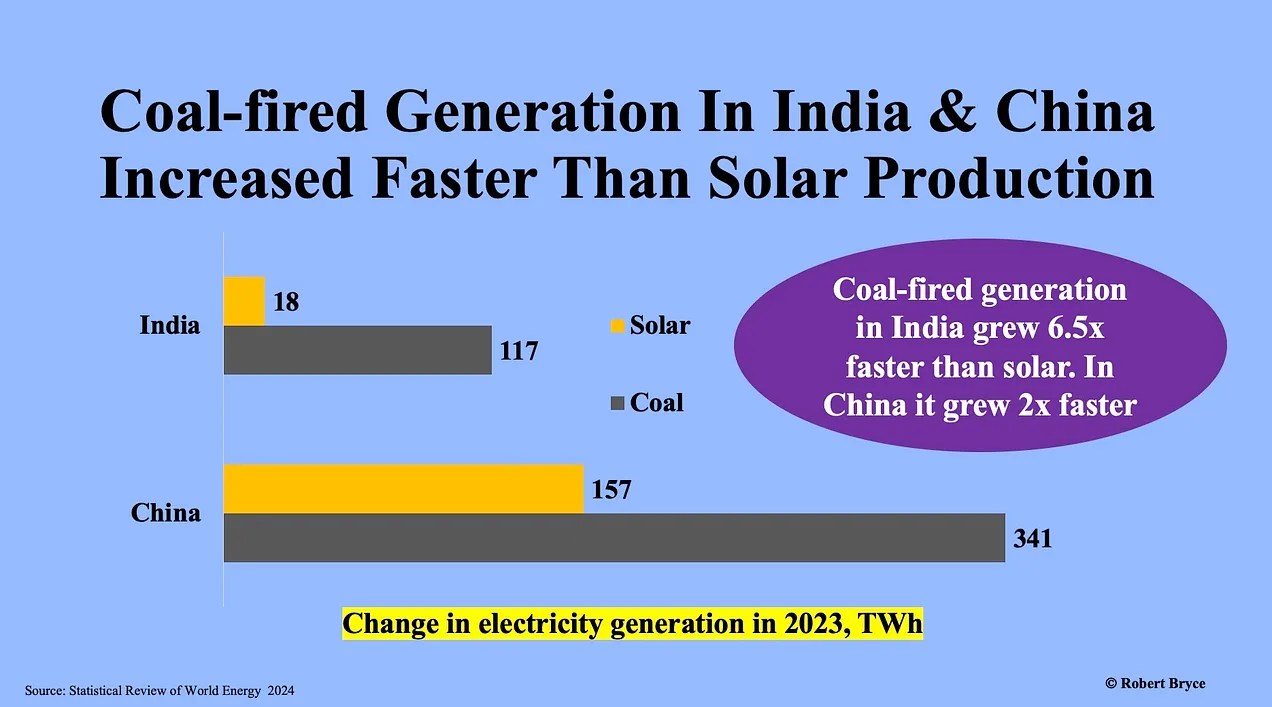
We are carpet bombed with claims that alt-energy — and solar in particular — is cheaper than other forms of electricity production. And yet, in China and India, coal-fired generation continues to grow faster than solar. Maybe they didn’t get the memo.
I will continue pulling numbers from the Statistical Review until June 2025, when the next edition is published. And I will repeat here a line I use in my speaking engagements: These aren’t my numbers. These are the numbers.
And the numbers don’t lie.
Substack


Renewable metaphor endless?There is no perpetual motion machine in the world.
https://aemo.com.au/Energy-systems/Electricity/National-Electricity-Market-NEM/Data-NEM/Data-Dashboard-NEM
This energy provider shows on its website, Tab “Renewable Penetration“
The below figure is the maximum renewable penetration rate ever recorded with
MAX 72.1%, 20,365 MW, Tue, 24 October, 2023, 13:00
funny the sentence below: We’re aiming to enable 100% renewable energy at any point in time
Our goal is to co-design and co-engineer the NEM and the WEM to manage 100% instantaneous penetration of renewables at any moment on any day by 2025.
Best regards
Andy
My calculations of storage amounts, using years of real data (since 2011 for California and since 2018 for USA as a whole) ought to frighten renewables’ advocates, but they make excuses. For California, the result is 1,160 hours’ storage. For USA as a whole it’s 2133. For EU as a whole, Denmark, and Germany it’s about 950 hours. With today’s battery prices and lifetimes, including transportation, installation, decommissioning, and destruction or recycling, the cost for an all-electric all-renewable 1,700 GWe American energy economy would be only thirty times total GDP — every year — forever. I tried to analyze Australia, but the data are a mess and AEMO is not helpful. Details at http://vandyke.mynetgear.com/Worse.html
I confronted my Assemblywoman with these numbers and she started nattering about hydrogen. I pointed out that the end-to-end efficiency of electrolytic hydrogen using fuel cells is about 22%, and asked for the name and location of one working industrial-scale hydrogen storage project, and she changed the subject to traffic signal cameras.
This website is not displaying correctly – I cannot read any of this post. Please fix! Peter Dingle.
Try another browser, it’s fine at our end.