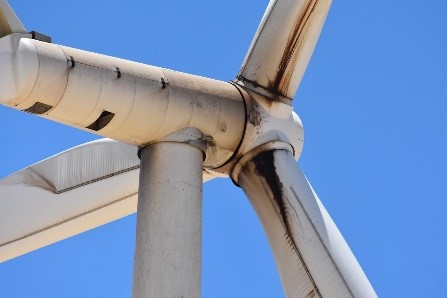
The Sun and wind might be free, but wind and solar power are by far the most expensive power sources, of them all.
Diffuse and dilute – entirely dependent on the weather (wind – in the case of wind power, and cloud cover in the case of solar) and, in solar’s case, where the Sun sits in the sky – every MW of wind or solar capacity has to be backed up by a MW of reliable, dispatchable capacity, from either coal, gas or nuclear power (and hydro where that might be available).
Over the years, renewable energy rent seekers have attempted to paint a very different picture; viz, by claiming that wind and solar are ‘free’ and getting cheaper all the time. The accounting tricks employed are fairly obvious for those with the faintest idea about how electricity is generated and distributed.
Donn Dears is one such character. Here he is explaining why wind and solar are the most expensive (occasional) power generation sources, of them all.
Lazard Wind and Solar Costs – Part 1 and 2
Power for USA
Donn Dears
9 November 2021
The media consistently cites Lazard to claim that wind and solar costs less than electricity from natural gas combined cycle (NGCC), coal-fired and nuclear power plants.
In 2017, my article published a review of Lazard’s methodology, using the limited information they provided.
This review established that Lazard’s methodology was compromised and that the levelized cost of electricity from wind and solar were not lower than the LCOEs from fossil fuel and nuclear power plants.
Lazard has never refuted my review, so I can only assume my review correctly reflects Lazard’s procedure.
This article will republish the information published in 2017. A few additional comments are contained in the conclusion.
From 2017:
Lazard Assumptions
Lazard held financial costs, such as the cost of debt and equity, constant when making calculations for each type of facility. This was an effort to ensure that calculations between facility types were fair. However, there were at least two instances where this assumption was misleading.
- Natural gas combined cycle (NGCC) plants were assumed to have a life of twenty years, which is half the life that should have been used. Financial costs should have been amortized over 40, not 20 years.
- The investment cost for a coal-fired power plant was assumed to be $3,000 per KW. This is higher than actual historical costs for supercritical plants ($2,100/KW) and slightly higher than for ultra-supercritical plants ($2,800/KW). This imposed a financial penalty for coal-fired power plants.
There were two important assumptions in the Lazard study that were either questionable or that slanted conclusions unfairly to the benefit of wind and solar. These are addressed in (1) and (2). A third factor was omitted from the study and is addressed in (3).
- Capacity Factor
Capacity factor (CF) is defined as the amount of electricity produced over a year by an installation, compared with the amount that could theoretically be produced based on the facility’s nameplate rating.
The Lazard study refers to “resource availability”, and it is unclear whether the CFs used in the study are true CFs or ersatz CFs based on some undefined resource availability calculation.
Because this is unclear, both possibilities are addressed for wind.
Alt 1: Traditionally Defined CFs
The capacity factor (CF) for wind used in the Lazard study was significantly higher than experience from existing installations. The study used 55% in one instance and 38% in another.
Actual CFs, as reported by DOE in its 2015 Wind Technology Report, averaged 32.8%, between 2011 and 2015; 31.8% between 2006 and 2010; and 30.3% between 2000 and 2005.
New, taller units with longer blades will probably have higher CFs, but not anywhere near 55%. (Probably closer to 40%, based on installations since 2017.)
Wind installations in high wind areas, such as Montana where CFs could be higher, require long and expensive transmission lines, the costs of which are not included in the Lazard or many other studies.
The use of higher CFs and lower capital costs in the Lazard study, skewed the LCOEs for wind, making them unreasonably low.
Alt 2: Ersatz CFs
The Lazard study may have used a specially designed “capacity factor as a proxy for resource availability”.
Why this would be done is unclear since actual wind resources have been carefully mapped across the United States for heights of 30 meters, 80 meters and 100 meters above ground level.
The best winds for generating electricity are predominantly in the upper plains states such as Montana, and across the front range of the Rocky Mountains.
The regional factors used in the Lazard study do not appear to align with the wind maps available from NREL, though these regional factors were apparently used to represent wind availability across the country.
The Lazard study did not explain how these ersatz capacity factors were determined, so there is no way to determine their appropriateness or accuracy.
For this reason, the LCOEs developed by Lazard using ersatz CFs for wind are suspect, and not comparable to traditionally determined LCOEs.
2. Solar
The Lazard study seems to have used a specially designed “capacity factor as a proxy for resource availability” when determining LCOEs for solar.
Presumably “resource availability” refers, in some manner, to insolation levels.
“Resource availability” was apparently used to establish, what can best be described as ersatz capacity factors for solar installations.
Insolation levels are readily available for all areas of the world, so it begs the question of why Lazard chose to create a “resource availability” factor for solar.
Insolation levels for the Southwestern United States are substantially greater than those for the Midwestern United States, yet the LCOEs arrived at for solar by the Lazard study did not reflect these substantial differences.
For this reason, the solar LCOEs developed by Lazard are suspect, and not comparable to traditionally determined LCOEs.
Again, The Lazard study did not explain how these ersatz capacity factors were determined, so there is no way to determine their appropriateness or accuracy.
The report did confirm that rooftop PV solar is uncompetitive. As demonstrated in Nothing to Fear, PV rooftop solar is uneconomic in every state except possibly Hawaii.
3. Reliability
Both wind and solar are intermittent, and in some respects unreliable.
Beyond small amounts, it’s impossible to replace coal and natural gas power plants with wind and solar on a one for one basis. As mentioned earlier, these are not interchangeable LEGO pieces.
The CAISO Duck curve demonstrates this very clearly.
For example, wind and solar must also include expensive storage if the evening ramp-up is to be minimized. Coal and natural gas power plants must be retained to provide power at night and for when the sun stops shining or the wind stops blowing.
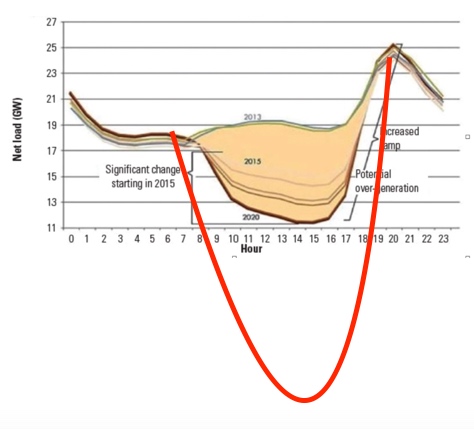
These limitations become increasingly worse as greater amounts of wind and solar are placed on the grid.
At the very least, LCOEs for wind and solar are misleading because wind and solar require the use of costly storage. More about the CAISO Duck curve is found in the book Nothing to Fear.
Lazard Wind and Solar Costs, Part 2
Conclusions—including new information
If an undefined “resource availability” is used to calculate LCOEs, the resulting LCOEs can’t be compared with a traditionally derived levelized cost of electricity (LCOE): It’s like comparing cashews with apples.
In addition, wind and solar are unreliable, and Lazard’s LCOEs do not fully reflect the extra costs associated with having to compensate for their intermittency and unreliability.
The Lazard report and nearly all media articles attempting to compare LCOEs between wind and solar installations and coal-fired and natural gas combined cycle (NGCC) power plants, are inappropriate and meaningless.
Wind and solar cannot replace coal and natural gas on a one for one basis … They are not interchangeable LEGO pieces.
Coal-fired and NGCC power plants continue to be the least costly methods for generating electricity, notwithstanding the Lazard study.
Since this review was published, additional information has been developed.
Need for storage
It’s been shown that the wind doesn’t blow and the sun doesn’t shine for extended periods:
For example, ISO-NE reported in the winter of 2018, that solar was virtually unavailable for 11 days in New England.
It has also been shown that the wind has failed to blow for as long as 9 consecutive days in Texas.

A battery has not yet been developed that can store large quantities of electricity for periods of 11 days, or longer. This means wind and solar will not be available when needed and that blackouts for long periods are a possibility. FREYR Battery is the only known battery to be under development that claims to be able to store electricity for six days, but this is still short of what is needed for a safe and reliable grid.
Former Obama, Energy Secretary, Moniz, said,
“Batteries should not be relied on for storage.”
Replacement costs
The cost of replacing wind, solar, and storage battery installations has been shown to be trillions of dollars, every 10 to 20 years, the life of the equipment.
This amount of investment required for wind and solar with storage is unsustainable and will bankrupt the country.
NGCC power plants last for over 40 years. Coal fired power plants can operate for 60 years, while nuclear plants last for 80 years. Consideration is being given to allowing nuclear power plants to operate for 100 years.
In its latest cost analyses, Lazard continues to assume that the life of NGCC power plants is 20 years, and that the life of nuclear power plants is only 40 years.
GE’s first modern NGCC power plants with heat recovery boilers were built in the 1970s, while other types date back to the 1960s.
Storage is measured in MWh or KWh not just KW. This makes it difficult to use a single cost estimate to account for the impact of storage. The cost goes up as the amount of storage hours increases. For any grid that does away with fossil fuels, long term storage is essential, and can’t be avoided. Storage costs must be added to the cost of wind and solar.
To put things in perspective, here is some raw data.
- Building an NGCC power plant costs $1,000 per KW, and lasts for 40 or more years.
- Building a land based wind turbine power plant costs $1,300 per KW, and lasts for 20 years. To this must be added the cost of storage which lasts for ten years.
Reliability
Wind and solar only supply small amounts of electricity compared with their nameplate ratings as measured by their capacity factor.
- The capacity factor (CF) for the newest land-based wind installations is around 40%. As noted in Part 1, existing units have CFs of around 30%.
- The CF for NGCC, and coal-fired power plants are around 80% when run as baseload plants and not in following mode.
- The CF for nuclear is over 90%.
Wind and solar generate electricity intermittently and can’t be relied on to supply electricity when needed. They cannot be used for reserve margins which are essential for preventing blackouts. The book, The Looming Energy Crisis, Are Blackouts Inevitable, describes why this is true.
Final Summary
Electricity from land-based wind and solar cost more than from NGCC, coal-fired, and nuclear power plants, while NGCC, coal-fired, and nuclear power plants are more reliable.
Lazard’s costs for land based wind and solar cannot be compared with LCOEs using long established methods.
Power for USA Part 1 and Power for USA Part 2


Definition of insanity: Repeatedly doing the same thing and expecting a different result.
Is the wind going to start blowing at an optimal rate along with the sun shining at night?
Politicians seem to think so. Go figure.
The most hideous looking things ever…and absolutely useless looking at our coastal outlook is no longer … a nice experience…
Here you find the Lazard (claims)
https://www.lazard.com/perspective/levelized-cost-of-energy-levelized-cost-of-storage-and-levelized-cost-of-hydrogen/
In his data, the value of the incoming sun is higher than it is measured at ground level – where all earth bound PV units are erected (at the ISS the sun comes with more power) . Also, clouds are very different and can not be leveled.
B.t.w, the CF of a turbine will not increase by longer blades.
Longer blades means a more powerful turbine. So that CF will be calculated with a higher rated power value.
The solar constant refers to the solar radiation received per second by the unit area of the atmospheric top perpendicular to the solar ray on the average distance between the sun and the earth (d = 1.496×10 ^ 8km).
2. The solar constant is measured outside the earth’s atmosphere in a plane perpendicular to the incident light. The value measured by satellite is about 1367 watts [1353 (± 21) w / m2] per square meter (NASA, 1976)when solar reach ground, it just 640w /m2,including all spectrum。Si panels just working on 400-1000nm.
Please read my articles and comments! Technically exposed the means of photovoltaic fraud.
For people who are too busy to click links, a recent study of the main Australian grid modelled six energy mixes to indicate comparative costs per MWh
1. Current $69
2. Replace brown coal with nuclear $72
3. Replace all coal with nuclear $90
4. Projecting 40% RE in the mix $450
5. Replace all coal with CCG $97
6. 100RE plus storage $416
https://epc.com.au/index.php/nem-model/
This was tabled in the NSW Parliament two years ago and apart from a piece in The Australian newspaper at the time I have seen no discussion or criticism of the results.
the link for part 2 is bad
I just found it there https://ddears.com/2021/11/16/lazard-wind-and-solar-costs-part-2/
Thanks. Updated.
Include the cost of “firming” and see what happens!
https://newcatallaxy.blog/2021/09/25/the-real-cost-of-unreliable-energy/
Cost of firming: Mearns calculated 390 Wh storage per watt of average demand for England + Scotland: http://euanmearns.com/grid-scale-storage-of-renewable-energy-the-impossible-dream. Rogers calculated 400 Wh for Texas: https://www.americanthinker.com/articles/2018/05/is_100_percent_renewable_energy_possible.html. I calculated 3,000 for California: http://vandyke.mynetgear.com/Worse.html.
Using the most optimistic result (always a stupid decision), looking in Tesla’s catalogue for prices and lifetimes, and ignoring installation and maintenance, one concludes that the cost for storage for an all-electric all-renewable American energy economy with an appetite appetite of 1,700 GWe would be ONLY FOUR TIMES TOTAL USA GDP EVERY YEAR!
Very good