
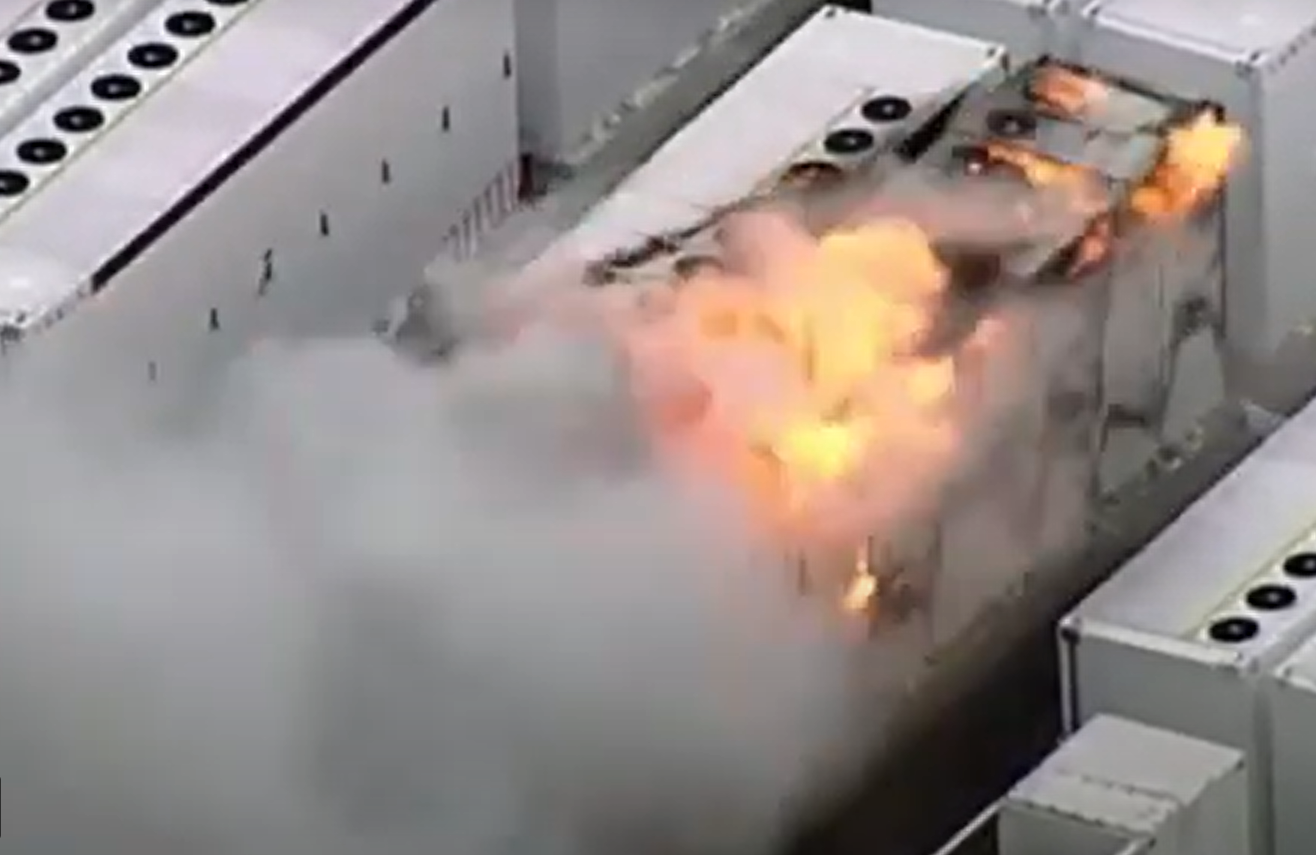
Renewable energy storage is literally setting the world on fire. When giant lithium-ion batteries aren’t exploding in toxic balls of flame, their limited capacity means that they add a trivial occasional trickle of electricity to the grid; and do so at an astronomical cost.
The wind and solar acolyte would have us believe that if we throw another few billion dollars at Elon Musk, we will quickly overcome the inherent intermittency of wind and solar.
The other line being spun is that wind power can be ‘stored’ for future use in pumped hydro systems. Like big batteries, pumped hydro involves converting one form of energy to another and reconverting it to electricity for ultimate use, with very substantial energy losses along the way.
But physics, economics, and even routine mathematics were never the strongest points of the wind and solar cult.
Michael O’Ceirin, on the other hand, always relishes the opportunity to run the numbers. And – surprise, surprise – he finds nothing about the claims made for renewable energy storage adds up.
Energy Storage: An Estimate Using Actual Data
Watts Up With That?
Michael O’Ceirin
13 August 2021
Abstract
Much has been written about using energy storage to stabilise renewable energy. This article uses actual data to present a theoretical answer to what may be achieved. The pattern of demand comes from actual Australian data as does the wind output. This has been put onto a website for public access and to be referenced by this article. The conclusion is that in the Australian environment on our eastern grid using wind and Pumped Hydro Energy Storage (PHES), for every TW hour 500 MW of wind and storage of 22 GW hours is needed for stability to match the existing demand pattern.
Requirements to maintain Status Quo
Australia faces five closures due to age of coal stations by 2034.
| Asset name | Year | Capacity MW | Dispatch 2020 | State |
| Liddell | 2023 | 2000 | 4.1% | NSW |
| Vales point B | 2028 | 1320 | 3.6% | NSW |
| Yallourn W | 2028 | 1480 | 4.5% | Vic |
| Eraring | 2030 | 2880 | 7.2% | NSW |
| Bayswater | 2034 | 2640 | 7.6% | NSW |
| 27.0% |
Since the Australian demand for electricity on the eastern grid in 2020 was 203 TW hours, renewables need to dispatch an extra 55 TW hours per annum to replace them. This cannot be done just on average. The same pattern of electricity demand must be satisfied. To do this theoretically wind and PHES has been chosen.
This estimate shows that to supply that amount of electricity under Australian conditions on the east coast 27 GW of wind generation and 1182 GW hours of energy storage will be needed.
Capital costs for the wind according to Gencost 20 – 21 (page 17), at $2000 per kW hour would be $54.3 billion plus a large cost in transmission lines. For the cost of PHES see appendix storage costs.
Energy storage is nowhere near as determinate as the renewable energy sources. PHES is a bespoke item which has extreme variation in price. Certainly, there will be a long-time frame for the building of PHES and producing sufficient to meet the requirement. According to this estimate the task of producing such a large amount of electricity storage may well be prohibitive. For the Gencost estimate the PHES would cost $62 billion and a Kidston (see appendices) equivalent $456 billion. Note that this cost has been minimised by assuming willingness to run at critical levels. In a practical world this would be unacceptable.
PHES Estimate
This is only needed for variable renewable energy since energy storage is not needed otherwise. Specifically, it applies to wind and solar production of electricity. This article concentrates on electricity produced from wind. The technology for the storage is confined to PHES. The reason for choosing that for electricity storage is its capacity and cost.
The estimate relies on data (see appendix Data Source) held on the author’s website Spasmodic Energy. This estimate uses the patterns of electricity production and consumption derived from that data.
First the demand must be known. The demand for electricity on the eastern grid in 2020 was 203 TW hours, on average 23 GW. For calculations of the energy demand this is not sufficient.

The electricity demand chart (figure 1) shows the pattern. On any day, demand is greatest in the early afternoon and the lowest in the early hours of the morning. This is expected and must be taken into consideration when calculating the energy storage requirement. It is suggested that estimates such as this should be done against a full year since there is a definite yearly pattern. By that means the low and high points of the year for wind will be included.
Using actual data an estimate has been made by stepping through each actual hour.

This is shown graphically on the energy storage page (figure 2). The pattern of the dispatched electricity is shown in the lower chart superimposed over the actual output of wind for the chosen time period. For each step, the assumption is made that the initial percent can be achieved. The steps to solving this are as follows.
- Is there enough electricity from wind to supply the demand for that hour?
- If so, add any excess to storage less 15% (to account for storage losses).
- If not, then draw enough from storage (there is a 15% loss here as well) to satisfy the demand.
- If storage has gone to zero or below then the run has failed. Reduce the demand percent by one and start again at the beginning.
The output is shown in figure 2. This is a run for the whole of 2020 starting with an initial charge of 350 GW hours and an expected demand of 10%. The demand is an expected percentage of the total demand for that year. As above it can be seen (on the right) that 10% failed as did 9% finally settling on 8%. The result is then displayed in the two charts. The top one shows the charge of the storage throughout the year. In the example it is stable until the end of January and then it falls and keeps on falling until early March where it sits at practically at zero for many days. The storage gradually builds up to become fully charged at the beginning of May.
Please note that the displayed example is static while the actual website is not. There the whole picture can be seen throughout the entire year by scrolling the display. This was found to be quite important since trying to display that amount of information in a static chart does not show what happens. The charge drops again to under 50 megawatt hours in August to again rise to a full charge at the end of August which remains until the end of the year.
The second chart shows what the result is. It is clear that energy storage reduces the amount of usable electricity. In 2020 wind dispatched 19.68 TW hours but it was not stable. If it is stabilised using energy storage the usable wind energy drops to 16.22 TW hours. The cost in this case for stability is a loss of 18%. There is the overhead of the energy storage of 30% and when it is fully charged potential electrical generation is lost. In the energy storage chart figure 2 this can be seen in September (if scrolled).
Why is this so? It seems very extreme. The point is wind droughts are frequent and can be long. These can be found on the website under “wind droughts”. In 2020 many instances can easily be found where the capacity factor drops to under 5%. There is one extreme case where the average was 5.5% for 33 hours. There are others where the drop is to 2%. Despite the fact that the Australian eastern grid is very large, covering many thousands of square kilometres, the wind patterns are larger. The whole of Australia can easily have little wind also too much wind.
Conclusion
To stabilise wind energy generated during 2020 so that it is congruent with the demand 350 GWh of energy storage was needed. That will meet 8% of the demand using the existing wind infrastructure of 2020. The capacity of wind was 8 GW and 8% output is 16.22 TWh. So, for 1 TWh 0.5 GW of generation is needed. As a rule, 22 GW hours of storage are needed to stabilise 500 MW of wind.
As previously stated, five major coal stations will close before 2034 on the Australian eastern grid. Together they currently generate 27% of the electricity on the eastern grid. That is 55 TW hours so applying the rule 1181 GW hours of electricity storage will be needed. At a minimum cost of $52 million per GW hour the total would be $61.5 billion.
Appendices
Source Data
Australia has a grid along the whole of the eastern coast which connects generators. That grid is monitored by the Australian Energy Marketing Operator AEMO who records and publishes pricing and performance data at five-minute intervals. That data is used in this estimate. To enable the use of this data on a website it has been transformed to hourly data. Currently there are 150 million data points. Wind is used as the source of the renewable energy which in Australia is spread over a large area.
Pumped Hydro Energy Storage (PHES)
This estimate assumes that this can be provided with sufficient capacity. To estimate the cost the Gencost 20-21 study (page 19) can be used. In Australia, there is a proposed large PHES to be built known as Snowy Mountains 2.0 (SM 2). It is projected to be able to deliver 2000 MW for 175 hours. This results in a capacity of 350 GW hours. The default trial figure is the same, but other figures can be applied of course to the storage page of the website.
Gencost gives a cost per kW and that cost is for 48 hours. The cost for 2000 MW on that basis is $5 billion. Matching it to 350 GW hours means it must be multiplied up and the result is $18 million of $2 million per GW hour. The Snowy Mountains 2.0 as previously stated is the same as this in capacity. The cost that has been often stated is $10.4 billion. That makes it far cheaper than the Gencost study would allow, even though the cheapest has been chosen out of that study, since much of the work has already been done. Possibly it is an exception.

Kidston is being built in Queensland in an old gold mine. Compared to SM 2 there are significant differences. It is much smaller and much more costly. The capacity is 2000 MW hours. The cost is $386 million per GWh.
Watts Up With That?

Hi STT, and Mike O’Ceirin,
First, a big “thank you” to Mike for doing this analysis. As one who has done this sort of long-term analysis on AEMO data, I have some limited understanding of the effort involved.
At: https://joannenova.com.au/2021/08/the-tesla-battery-fire-burned-for-longer-than-it-operated-for/ , of 03 August 2021, I offered a comment to contributor “Neville” who asked: “So how long would this Geelong battery disaster power Victoria? Would it be for 10 minutes , 20 minutes? Anyone care to GUESS?
My reply is at: https://joannenova.com.au/2021/08/the-tesla-battery-fire-burned-for-longer-than-it-operated-for/#comment-2449942 .
I think it is very relevant to Mike’s analysis here, so I am posting a paraphrased version here:
If the numbers 300 MW and 450 MWh are correct, then this Geelong “big battery”, when it is not on fire, is rated to supply a maximum of 300 MW, if starting from a fully charged state, for 450 MWh / 300 MW hours, or 1.5 hours.
As to determining Victoria’s power requirements at any one time, contributors such as Anton Lang (“TonyfromOz”) and, here, Mike O’Ceirin can provide much more detailed analyses than this “quick and dirty” one of mine. But here goes:
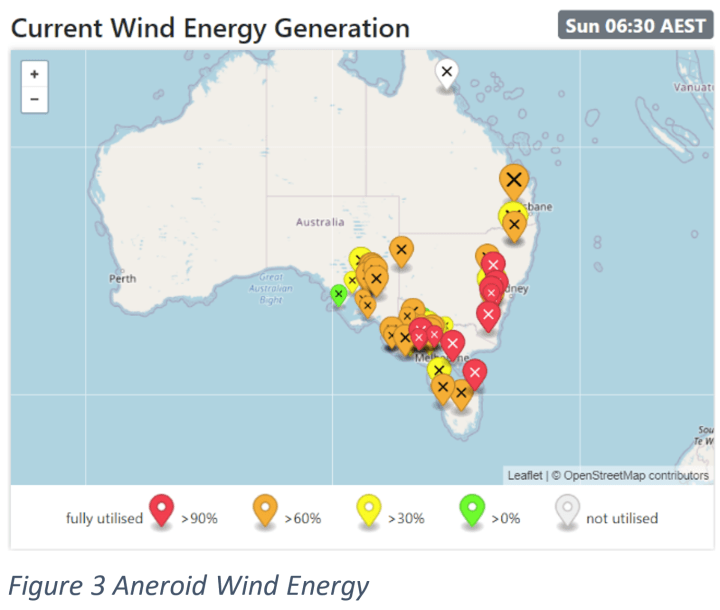
Looking at that day’s numbers (3 August 2021) at https://anero.id/energy/, and selecting “VIC1” in the region tab below the chart showing “Today’s Energy Production by Source”, maximum demand during the 24-hour period shown varies from a minimum of about 4.4 GW during the early hours to a daily maximum of 7.0 GW, or in MW, over a range of 4400-7000 MW.
The battery can supply a maximum of 300 MW, so the strictly correct answer to “Neville’s” question is that it cannot “power Victoria” for any time period at all. If, for the sake of the exercise, we were to presume the hypothetical situation that it could provide say the minimum value (4400 MW) of the above demand figures, but always remembering that it cannot, then the length of time that such a hypothetical 450 MWh battery could “power” Victoria is 450 MWh / 4400 MW hours. If my calculations are correct, the answer is 0.102 hours, or 6.14 minutes. But, as I say, this battery’s output, if we are to believe the figures provided by the operator, is limited to a maximum output of 300 MW, so it cannot address the whole of Victoria demand ever.
A more useful calculation might be to ask how many of these 450 MWh batteries would be required to “replace” Victoria’s brown coal powerstation capacity.
Here in Australia, I am aware that calculations such as these have been done by Rafe Champion’s group, and I am aware of such studies elsewhere, so would not presume to question their findings. But again, here is a “quick and dirty” estimate.
From the chart quoted above, Victoria’s brown coal powerstations seem to produce power at a fairly constant 3700-3800 MW for a large proportion of the time, so, for the sake of round figures, let’s say that 4000 MW of power has to be found as a replacement. Presuming that, given the present, mad, obsession with renewables, that the replacement will come by increasing wind and solar generation, then “big batteries” will be required to cover those periods when there is no wind, and no sun (cloudy days).
The first figure that has to be agreed upon is: what is an acceptable minimum time required for the batteries to be availabe to provide that minimum required power of 4000 MW?
The engineer in me says: take the maximum observed no-wind, no-sunlight period, and double it. I think we’re looking at a minimum period of 7 days for such a period. No doubt there would be much argument from some quarters that this is excessive, but we engineers are required to work to acceptable safety margins.
It is a relatively simple calculation to determine the MWh requirement:
4000 MW x 7 days x 24 hours/day = 672,000 MWh
To find the number of 450 MWh battery units required: 672,000/450
That’s 1494 “big batteries”, (the figure has to be rounded up to the next digit, not down when we speak of number of units required), just to attempt to “replace” Victoria’s brown coal powerstation capacity.
A moment’s thought indicates that, even though others might argue that my safety margin is excessive, even half that number (using a 3.5 day supply period requirement), would still result in a huge number of “big batteries”. And, don’t forget, this ballpark calculation presumes that all of these batteries are starting from a fully-charged state at the beginning of any such period – a highly unlikely scenario given the rampant intermittency of both the wind and solar generation that the battery storage is required to replace.
Here are a few more inconvenient questions that have to be addressed for this intermittent-generation-plus-batteries to actually work:
1. How much additional wind and solar capacity is required to meet the fully-charged-at-all-times requirement?
2. What is the up-front CO2 emissions resulting from the mining, milling, manufacture, transport, installation, etc., of so many “big batteries”? (That’s the CO2 emitted even before they are commissioned.)
3. What is the land use requirement for all these “big batteries”? (Include any additional spacing requirement that will surely result from the imposition of the necessary safety standards that will result from this present fire.)
4. What is the mining and other environmental impact of the requirement for the provision of all of the toxic materials that are clearly a requirement in the building of these “big batteries”?
And that is resulting just from the presumed “replacement” by “big batteries” of one set of the coal-fired powerstation requirement merely for the State of Victoria. What are the effects of attempting such a replacement Australia-wide? Mike’s valuable analysis takes us further towards answering those questions.
I have no doubt that others here will find a further raft of equally difficult, extremely inconvenient, questions.
One contributor, “Chad”, for example, said:
“Paul, far too detailed…..but I think you ignored the 15-20% energy loss between power to charge and useful discharged power for the battery !….
However,.we agree that battery is no good for bulk power supply!”
“Chad”’s comment there on the losses is absolutely correct, and taking them into consideration as well can only further increase the numbers of “big batteries” required.
Whether or not my scenario is too-detailed, it has a very serious purpose. I merely provided a “back-of-envelope” calculation that demonstrates that, even if we ignore the detail of the actual energy losses, the actual depth of discharge achievable, etc., and all those other very significant engineering realities that result in a very significant increase in the actual number of “big batteries” required, what my numbers show is that what we have here is a completely ineffective and totally pointless “solution” as a means to effect a policy to substitute and replace coal-fired generation.
Policymakers, who, in my experience, are for the most part completely ignorant of engineering realities, just might take some notice of the mouth-watering numbers that I present here, and of course, that Mike has rather better presented in his analysis (above). After all, it is possible, however unlikely, but when forced to provide answers to such as treasurers, that they might be capable of multiplying the capital cost of one 450 MWh “Geelong” battery by the necessary lazy 1500 or so “Geelong big battery” units demonstrated as being an unavoidable minimum requirement by this analysis, and then by doing a comparison with Victoria’s GDP data, they might just realise that, as Mike deftly shows, that the task is hopelessly impossible. That’s when it becomes interesting: it’s at that point, that one lays in with the engineering realities that conclusively demonstrate that these people live in fairyland.
Regards to All,
Paul Miskelly
Thanks Paul.
Paul I know we have had our differences in the past but I am greatly appreciative of your comment, thank you. Currently I am setting up a reference page on my website https://spasmodicenergy.com/Pages/Home.aspx. With permission I would like to put your comment on that reference page.
Something that occurred to me a little while ago and having no electrical engineering training previously I had missed something. I think you wrote the Geelong battery storage was 300 MW. I think that means that unless you need to draw less than or equal to that it is dead in the water. I refer to batteries when talking about the grid as tinker toys. The finances of Kidston are interesting the principal interests behind it have not risked any money.
Electrical power is non-renewable energy, no one can store it, it is impossible to stored, it can only be used and turned into other energy.