
There’s a yawning gulf between what wind turbines and solar panels are capable of delivering and what’s actually delivered. Sunset and calm weather will do it every time.
Terms like “capacity factor” and the “Levelized Cost Of Energy” are bandied about with great scientific certitude by renewable energy rent-seekers.
As to the first, wind and solar advocates always overstate the output of wind turbines and solar panels; and then, only in terms of pointless averages. As to the second, these characters are bound to lie about the true LCOE of wind and solar, as well. The subterfuge is as much about omission as embellishment.
Willis Eschenbach explains the nature of the game below.
The Real Cost of Wind and Solar
Watts Up With That?
Willis Eschenbach
25 June 2021
I keep reading how wind and solar are finally cheaper than fossil fuels … and every time I’ve read it, my urban legend detector rings like crazy.
It rings in part because the market is very efficient at replacing energy sources based on their cost. Here, for example, is the story of kerosene, emphasis mine:
When a clean-burning kerosene lamp invented by Michael Dietz appeared on the market in 1857, its effect on the whaling industry was immediate. Kerosene, known in those days at “Coal Oil”, was easy to produce, cheap, smelled better than animal-based fuels when burned, and did not spoil on the shelf as whale oil did. The public abandoned whale oil lamps almost overnight. By 1860, at least 30 kerosene plants were in production in the United States, and whale oil was ultimately driven off the market. When sperm oil dropped to 40 cents a gallon in 1895, due to lack of demand, refined petroleum, which was very much in demand, sold for less than 7 cents a gallon. …
SOURCE
My question was, if wind and solar are so cheap, why are they not replacing traditional sources overnight?
So I decided to look into the question. The main number used to judge how expensive an energy source might be is called the “LCOE”, the Levelized Cost Of Energy. It takes into account all of the costs for new power plants—capital costs, overhead and maintenance costs, fuel costs, financing costs, the whole gamut of expenses for that power source. Well … except for one cost, but we’ll come to that later.
Here is the latest information on the LCOE for various energy sources, from the U.S. Energy Information Administration (EIA) 2021 report entitled Levelized Costs of New Generation Resources.
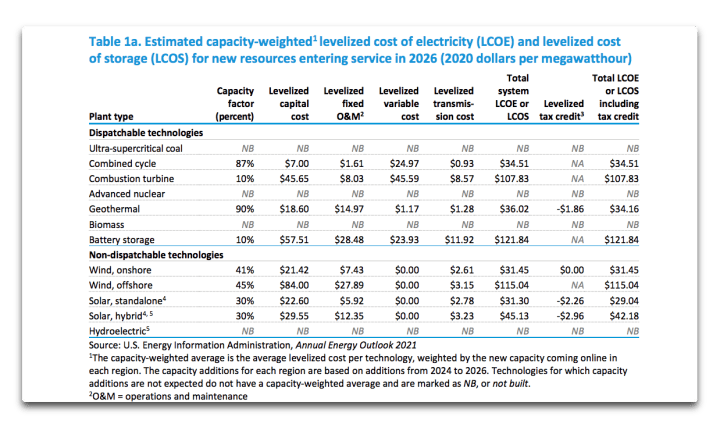
Figure 1. US IEA levelized costs of electricity, 2021.
And yes, that clearly says that onshore wind and standalone solar are cheaper than any other source of energy.
I looked at that, and my urban legend detector started flashing red and the needle pegged out … why?
Because of the numbers in the first column, the “capacity factor”. The capacity factor for an electricity generation system is what percentage of the “nameplate” generation it actually produces. For example, if the nameplate on a windmill says it will generate 16 gigawatt-hours (GWh, or 109 watt-hours) per year if it ran 24/7/365, and due to the intermittent nature of wind it only actually generates a quarter of that, then its “capacity factor” would be 25%.
I looked at the claimed capacity factors for wind and solar, which according to the US EIA folks are 40%+ and 30% respectively, and I thought “No way. Not possible.”
Now, part of the error in the solar capacity factor is explained by footnote 4, viz:
Technology is assumed to be photovoltaic (PV) with single-axis tracking. The solar hybrid system is a single-axis PV system coupled with a four-hour battery storage system.
Why is that a problem? Well, because tracking systems need to move each individual solar panel at a steady rate during the day so the panels always face the sun. Then, at the end of the day, they rotate the panel back to its starting position. Unlike fixed systems, these require a complex installation of motors, time sensors, bearings, levers, and the like to rotate the panels.
And because such mechanical “single-axis tracking” systems are expensive to install, expensive to operate, expensive to maintain, and subject to damage from weather, it is very rare for a grid-scale solar farm to use such systems. Almost without exception, they are fixed-angle systems with the panels mounted securely to a (theoretically) wind-proof frame like those at the Topaz Lake Solar Farm shown below.
If you imagine the necessary motors, gears, levers, and other mechanisms required for a single-axis tracking system to be able to rotate each and every one of those nine million! solar panels to follow the sun throughout the day, you’ll understand why fixed solar panels are the norm for grid-scale installations.
In any case, I thought I’d find the real data on this question of capacity factors. The amazing source, Our World In Data, has all of the information needed. Here is the current average of all of the world’s real-world wind and solar installations in the most recent year for which we have data, 2019.
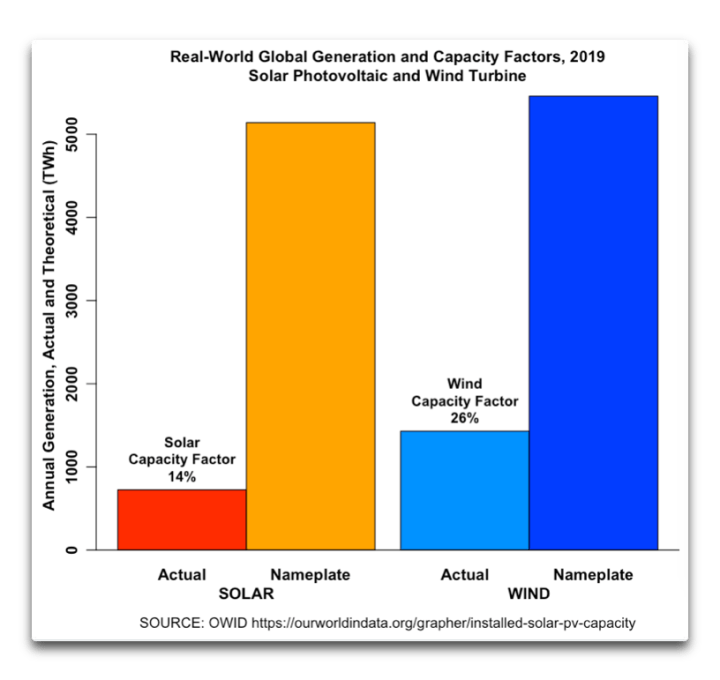
Figure 2. Actual and theoretical (nameplate) generation, 2019 data.
As you can see, the US IEA is way off in fantasyland about the capacity factors of wind and solar. In both cases, they are claiming far larger capacity factors than we have out here in the real world.
Now, in Figure 1, they claimed levelized costs as follows, in US cents per kilowatt-hour:
- Combined-cycle gas — 3.45¢ per kWh
- Solar — 2.90¢ per kWh
- Onshore Wind — 3.15¢ per kWh
That’s the basis for the claims that renewables are now the cheapest sources of electricity. However, given the actual capacity factors, in reality these costs are:
- Combined-cycle gas — 3.45¢ per kWh
- Solar — 6.21¢ per kWh
- Onshore Wind — 4.97¢ per kWh
“Cheapest sources”? No way.
And as for offshore wind, they’re just as far off. They claim 11.5¢ per kWh, but the new Block Island offshore wind farm is charging the utility, not the customer but the utility, 24.4¢ per kWh …
And finally, there is a huge elephant in the US EIA room … backup power. This is the missing cost I mentioned above.
If you add a gigawatt of unreliable intermittent renewable wind or solar energy to a system, you also have to add an additional gigawatt of some kind of reliable dispatchable energy, where “dispatchable” means you can turn it up or down at will to replace renewables when there is no wind or sun. The US EIA levelized cost document linked above does mention the need for backup … but it doesn’t even touch the cost of backup. All it says is:
Because load must be continuously balanced generating units with the capability to vary output to follow demand (dispatchable technologies) generally have more value to a system than less flexible units (nondispatchable technologies) that use intermittent resources to operate. The LCOE values for dispatchable and non-dispatchable technologies are listed separately in the following tables because comparing them must be done carefully.
They say that dispatchable technologies have “more value to a system” … but they fail to mention that “more value” translates into higher real-world costs for non-dispatchable renewable technologies.
How much higher? Well … they don’t say. But you can be sure that it won’t be free. At a bare minimum, it will be the capital cost of the dispatchable backup generator plus some portion of the other fixed, variable, and transmission costs … and that means that because of the costs of the needed backup generators, there is very little chance that solar and wind will ever be competitive with other methods.
Watts Up With That


Hey guys, one important point has been forgotten here above:
* OK, it is nice to collect instable renewable energy data,
* BUT, its is better to evaluate which part of produced energy is effectively used…
Looks about Denmark situation:
No PV park (at least a fine decision due to their high latitude)
Oversized wind park: Name plate power 5 times larger than average Denmark power needs: As soon as winds blow a little, they jump to overflow and export most of it to near-by Norway/Sweden which are both combined 75% hydraulic and 22% nuclear. Exporting at very low prices (undesired power) and buying back almost 50% of national electricity needs (at high price since steerable), where is economic danes’ benefit?
Even worse, no CO² saving at all since hydraulic and nuclear are carbon-free techniques!
Of course this occurs in any oversized wind sources.
But compare with nuclear-based France: The medium size Wind power name plate (30GW) is about half of average electric network needs (55GW).
French authorities have published global results giving a miserable 7% “usable availability / nameplate” factor for Wind Power, enjoying a by-law priority to deliver (when wind is available, nuclear, gaz and hydraulic recede to balance the network.
BC is awash in spring runoff, dams overflow, flooding occurs, most solar power is made. Millions in public money subsidizing solar that has the same value as the water spilling. Zero, nada, zip. $0. One can attribute value for solar when all that water, our winter batteries begins to draw down. During these months solar capacity factor generously, maybe 3%. My city has its own hydro electric generation, our money machine, they put solar panels at the dam. Find something more absurd if you can. I try to educate the power of the greenwashers and politics is overpowering. Read my blog.
A few days ago you stated baldly that “the only serious solution is nuclear power”. And the costings and inefficiencies related here and in other posts are unarguable. Thinking of South Australia, from where I believe this blog emerges, where would you locate a nuclear power plant? This is not a nimby question, at least not on my part, but one of practicalities.
Torrens Island and Pt Augusta.
Thanks for that. Port Augusta might just be able to receive the approval of the general public.
Only healthy and wealthy countries like the USA, Germany, Australia, and the UK can subsidize electricity from breezes and sunshine, and intermittent electricity at best. The 80 percent of the 8 billion on earth living on less than 10 dollars a day cannot subsidize themselves out of a paper bag. Those poorer countries must rely on affordable and abundant coal for reliable electricity, while residents in the healthy and wealthier countries pay dearly for those subsidies with some of the highest cost for electricity in the world.
I’m not a fan of the term “Levelized Cost Of Energy” and adding yet another acronym to confuse, many just do not understand what that means. It’s like it presents an idea that we are levelizing the cost of energy by installing wind/solar. What’s wrong with making something level? Already in the first word the mind compares to so many things that are level or made level with fantastic results. Imagine a swimming pool NOT level or an entire home NOT levelized. “Cost Of Energy” is just that, cost of energy, everything costs something so people are used to that and it doesn’t really explain much. I’m not sure exactly what would be better but the basic concept I get when reading about comparing energies back in the 1800’s and how they evolved to be cheaper and better is that wind/solar are COMPLICATED MACHINERY and kerosene and whale oil are not. It’s like wind/solar is a car or truck and kerosene and whale oil are a horse that you do not build, you just feed it and they make new replacements by themselves. Kerosene and whale oil are simple fuels that you just hunt and gather. Machinery of wind and solar, unless we are talking Dutch wind MILLS that grind grain or a green house made of glass that uses solar power to keeps plants warm in winter, is energy use intensive in order to build and maintain as so many different parts must be manufactured, distributed, assembled, and then lubricated with snake oil.
An interesting Australian study with a nice range of options and a realistic attempt to get a fix on “firming” for intermittent providers.
https://www.riteon.org.au/netzero-casualties/#218
The estimate for 100% RE is north of $400AU per KWh.
The capacity factor for the SE Australian wind fleet is a tick under 29%. It is very low in Germany due to wind droughts and also ageing turbines and possibly clustering as well.