In their sillier moments, wind and solar advocates claim that we’ll all soon be driving electric vehicles, lovingly recharged with sunshine and breezes.
In Australia, those seemingly virtuous souls with EVs are really being propelled by coal, because 85% of the electricity passing through its Eastern grid comes from coal-fired plants. It’s an irony, to be sure.
Beyond forcing us to purchase overpriced and under-performing EVs, the next target for the profiteering anti-CO2 squad is electrifying industry.
Apparently, by switching the energy source used in industrial applications to electricity, there are huge savings in carbon dioxide emissions to be made. The argument presupposes, of course, that the electricity that an all electrified industry consumes would all come from wind and solar.
And that’s where the push for industrial electrification using subsidised renewables comes unstuck.
Wind and solar are not costly simply because of the massive subsidies required to make them profitable for the owners of the assets that occasionally produce them, but also because end users pay twice over for their chaotic intermittency – by paying over the money to obtain dispatchable power during calm weather and after the sun goes down.
Mark Krebs and Tom Tanton unpack the engineering and economics underpinning the move to electrify industry using wind and solar. And reach the conclusion that if there really was an economic case to be made for industrial electrification using renewables it would start by removing all subsidies to wind and solar, now.
Mark Krebs, an engineer by training, has been involved with energy efficiency design and program evaluation for more than thirty years. He has served as an expert witness in dozens of energy-efficiency filings, which he first summarized in a Public Utilities Fortnightly article, “It’s a War Out There: A Gas Man Questions Electric Efficiency” (December 1996).
Tom Tanton is Director with Energy and Environmental Legal Institute. Tom has 40 years in energy and environmental policy, focused on enabling technology choice and economic development. He has testified to numerous state Legislatures and Congress as an expert on energy policy. He formerly served as Principal Policy Advisor at the California Energy Commission.
Problems of Industrial Electrification (forced decarbonization on the firing line)
Master Resource
Mark Krebs and Tom Tanton
9 January 2020
“With 25.3 Quads ‘lost’ in the transition from ‘source’ to ‘site’ (a.k.a. metered) electricity consumption, the overall electrical generation efficiency in industrial processes is 34% (13 Quads ÷ 38.3 Quads). In comparison, direct use of fossil fuel on site at industrial facilities generally exceeds 90%.”
“Industrial electrification is largely being driven by the same cabal pushing deep decarbonization and is further undermining our market economy. The solution: Remove subsidies, mandates and other forms of energy favoritism by letting technologies advance or fail in markets based upon their own true merit or lack thereof.”
Previous articles at Master Resource have focused on “deep decarbonization” through allegedly beneficial electrification of residential and commercial buildings. We’ve discussed the negative consequences of various policy regimes to deny consumers choice to best satisfy their energy usage requirements.
Other posts have focused on electric vehicles (EV’s) as part of a grand public effort to back-out motor fuel in favor of what is hoped to be renewable-based electricity. (As it is now, EV’s are ‘emission elsewhere’ vehicles.)
What about industrial electrification, a large potential target for the deep-decarbonization movement.
Since about 1984, advocates of electrification have had a loud voice on the topic of industrial electrification. But what is the rest of the story? Why does the self-interest of plant owners reject a politically correct substitution? The purpose of this article is to address some of the consequences (unintended or otherwise) thereof of industrial electrification.
Electricity by End Use Sector
The following diagram outlines the basic roadmap for the envisioned electric load growth via “beneficial” electrification in terms of Quadrillion Btu’s (Quads or 1015 Btu):
Electricity by End Use Sector
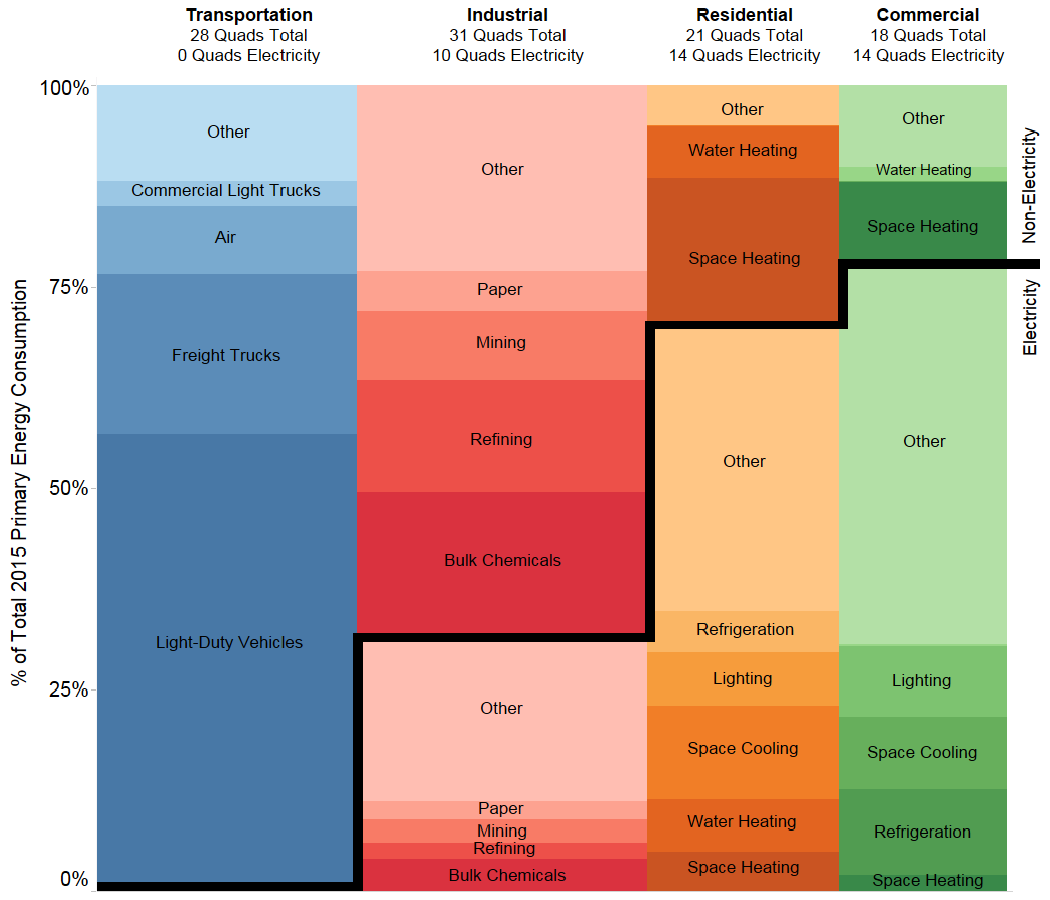
The area above the solid black steps represents the theoretical yet technical potential for converting from the direct use of fossil fuels to electricity for each of the sectors portrayed. The above diagram can be further simplified to show market share potential per sector for increasing electricity consumption as follows:
- Transportation: 28 quads minus 0 = 28 Quads
- Industrial: 31 Quads minus 10 = 21 Quads
- Residential: 21 Quads minus 14 = 7 Quads
- Commercial: 18 Quads minus 14 = 4 Quads
Total = 60 Quads
As shown above, total electrification potential for these four economic sectors equals 60 Quads. For reference, the U.S. Energy Information Agency (EIA) states that 13 Quads of electricity were sold at retail in 2018; requiring the consumption of 38.3 Quads of primary (a.k.a. “source”) energy consumption of various forms per the following graphic:
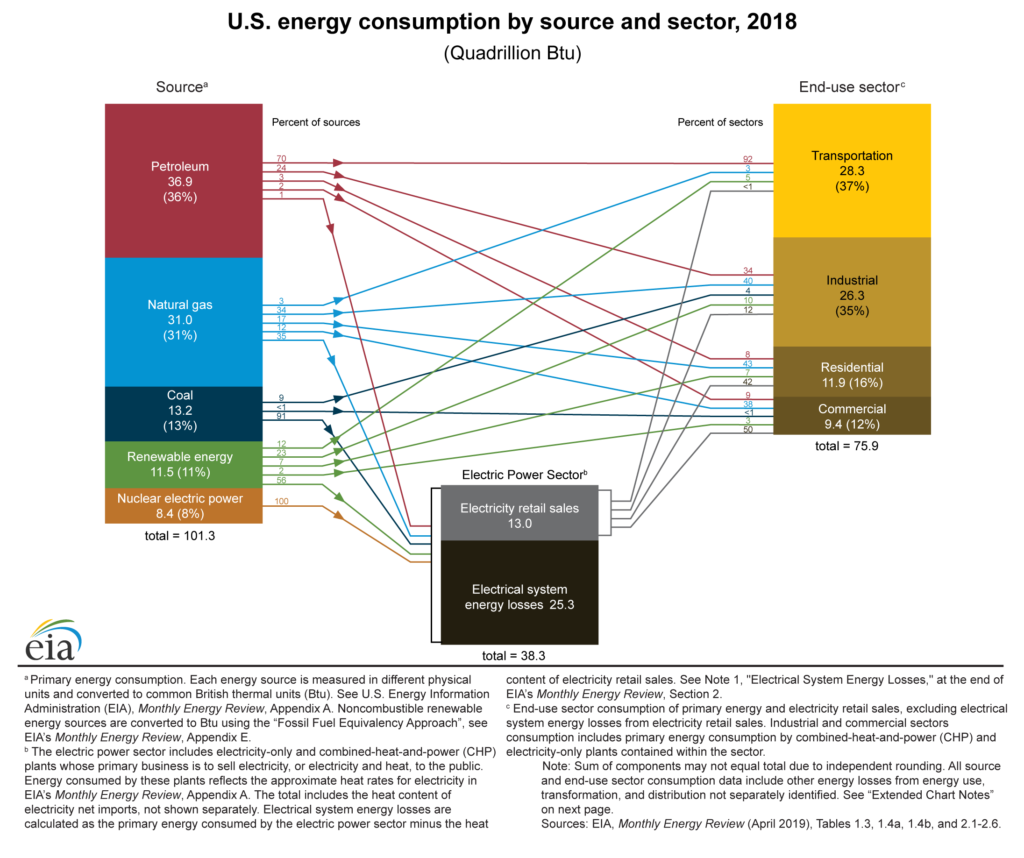
With 25.3 Quads “lost” in the transition from “source” to “site” (a.k.a. metered) electricity consumption, the overall electrical generation efficiency for industrial processes is 34% (13 Quads ÷ 38.3 Quads). In comparison, direct use of fossil fuel on site at industrial facilities generally exceeds 90%.
In other words, for every Quad of electricity delivered to consumers, there are nearly two (2) Quads of waste (1.95 Quads to be more exact). Thus, increasing the use of electricity by 60 Quads would entail an additional 117 Quads of waste (at 2018 overall electricity efficiencies according to EIA’s most recent data), not to mention the huge misallocation of capital to build additional (redundant) generation and transmission infrastructure. This misallocation may exceed $30 Trillion.
According to the National Academies of Science (NAS), natural gas provides the largest portion of U.S. industrial energy use overall (at 30% and growing in 2015). However, different industries have vastly different energy intensities and requirements; thus, vastly different proportions of total production costs represented by energy.
It is also important to recognize that different industries have different requirements for the quality of energy they require. Industries reliant on digital controls, such as computer chip manufacturers, require ‘perfect power’ in the form of “nine-nines” reliability, but also zero harmonic distortion and voltage/frequency variation. That requires electricity.
Generally, industries more reliant on providing heat are served quite well at less cost by the direct use of fuel.
However, “nine nines” quality electricity can also be produced on-site through natural gas-fueled combined heat & power (CHP); with the added benefit that any thermal requirements may be simultaneously offset through “waste” heat recovery.
Natural Gas Beats Renewables
In comparison with advanced gas technologies, the purported environmental and economic benefits of full-scale electrification begin to look highly doubtful. Avoiding such doubts is usually abetted by beliefs that renewables will soon become the least expensive means of producing electricity; if they aren’t already; as argued by the International Renewable Energy Agency, Lazard and their darling technology advocates (e.g., “The Numbers are In and Renewables are Winning On Price Alone.”
Such beliefs are further predicated on the following fallacies:
- A belief that fossil fuels will forever increase in price.
- The value proposition of fossil energy versus renewable energy is the same.
- A willful ignorance of ongoing advances of non-electric energy alternatives.
The first two fallacies are evidenced by historical data and the intermittent nature of renewables. Further, while renewable equipment costs have been declining, fossil-fuel equipment and the commodity itself are also becoming more economic. Oil and gas costs, moreover, can be locked-in for months, years, or longer to remove price risk.
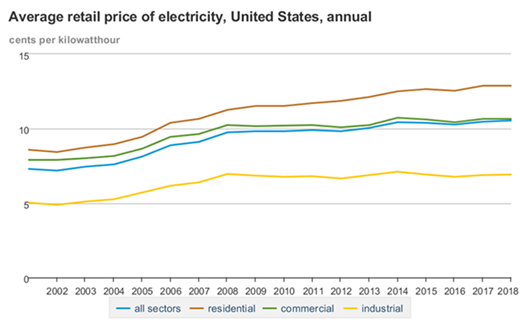
More importantly, renewable costs have not lowered overall retail electricity prices for any sector. Per EIA data, the opposite is true: electricity prices are increasing.
The following excerpt is from the above NAS reference:
Industrial energy needs are projected to grow by 31% during the next 25 years, when they will account for about 38% of total U.S. consumption. Part of this increase may occur because some manufacturing activities formerly located overseas are returning to the United States, in response to a recent trend toward lower natural gas prices prompted by increases in domestic production.
Leave the Market Alone
As predicted, such growth has returned to the U.S. and with it, record employment. The remaining discussion explains how government-imposed industrial electrification puts such growth at risk.
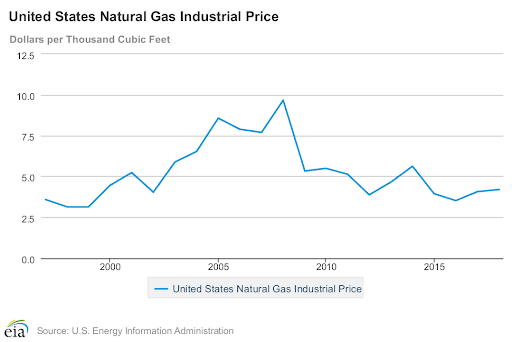
As the previous graphic illustrated, while average retail prices of electricity for industrial consumers is increasing, natural gas prices (tariffs) for industrial consumers is decreasing according to EIA data.
Like other consumer groups, industrial consumers usually opt for the most affordable energy choices (assuming they have a choice). Furthermore, industrial energy consumers are, at least arguably, the most economically literate about their energy choices.
However, energy prices are not the only costs that the industrial sector contends with. Labor costs and regulations (particularly environmental regulations) also affect profitability. Such concerns can and do cause industry to shut down or move elsewhere. Just look at the flight from California as evidence. Business flight (a.k.a. economic leakage) has real environmental impacts (a.k.a. emissions leakage) as further described below.
Increasing energy costs adds pressure that can lead to decreased overall employment and higher trade deficits. On top of this comes increased automation trends of the workplace. The main point here is that even just maintaining current favorable employment numbers is likely to become harder; there is nothing to be gained by unnecessarily adding cost burdens to industry and energy costs is one such burden.
Given these factors, there is at least a likelihood that present record employment may be short-lived because of a perfect storm of avoidable policy missteps, including:
- Rejoining the Paris Accord
- Implementing Carbon taxes and/or pricing (e.g., cap & trade)
- Refusing to let expire clean energy mandates (e.g., renewable energy portfolio standards)
- Allowing utilities to virtue signal at no cost by approving recovery of such costs through energy rates
To varying extents, these policies are in place in Europe but not yet widespread in USA. Thus, expanding such policies at home will only accelerate shifting industrial output to “elsewhere” like Asia, Africa and South America. Consequently, the probability exists for:
- Increased carbon emissions’ leakage due to moving manufacturing to countries with less stringent environmental regulation, as we’ve seen in California.
- Increased carbon emissions from transporting manufactured products over longer distances from maker to user.
- Reduced economic resources available to address more pressing social problems as articulated by Bjorn Lomborg fifteen years ago.
Further exporting industrial emissions out of the U.S. (and thus increasing total emissions) makes no sense environmentally or economically; yet that is likely to happen as a direct result of limiting consumer choice through ostensibly “beneficial” electrification. Instead, healthy competition is much better fostered through knowledgeable consumers free to select whatever energy alternatives best fit their specific requirements.
Conclusion
On December 12, 2019, the U.S. Department of Energy’s “Better Buildings” programs sponsored a webinar titled “Electrification – What Does It Mean for Energy Efficiency?” Basically, what it means is that utility energy efficiency programs may be increasingly ‘redirected’ to programs to minimize carbon at the point of energy end use. A case-in-point is summarized by the following slide; presented by the Sacramento Municipal Utility District:

While the title of the slide clearly states that it applies to buildings, industry uses buildings too and similar programs most likely will include a carbon takeover of industrial processes and transport. But don’t bother trying to find the presentation this slide came from: The presentation was only sent to registered attendees; so it is being made available here.
Appendix
Additional references advocating for industrial electrification:
- Forbes: How To Reach U.S. Net Zero Emissions By 2050: Decarbonizing Industry
- APPA (American Public Power Association): New loads, new challenges: Advancing industrial electrification
- NREL (National Renewable Energy Lab): Electrification of Industry
- LBNL (Lawrence Berkeley National Lab): Electrification of buildings and industry in the United States
The latter two references are federally (taxpayer) funded national labs actively supporting (advocating) the electrification of all energy uses in the U.S. The first two references are merely commercial interests exploiting federal “research” to advance electricity growth.
Meanwhile, industrial technologies that use natural gas directly are not dependent upon federal “energy efficiency” largesse but are also improving none-the-less. Examples are identified within the following links:
Industrial electrification is largely being driven by the same cabal pushing deep decarbonization and is further undermining our market economy. The solution: Remove subsidies, mandates and other forms of energy favoritism by letting technologies advance or fail in markets based upon their own true merit or lack thereof.
Master Resource


I was alarmed to read of your news South Australia, in today’s Australian Newspaper.
I believe the word you are looking for is…
DECEPTION!
Reblogged this on ajmarciniak.
Trying to work out what is going on in Qld with respect to these so called ‘renewable’ projects is a nightmare.
As I see it the Coopers Gap project which you mentioned has had 3 reference numbers under the EPBC, firstly 1008/4237 which was withdrawn on 29/10/2008. The next was 2008/4559 which was given the OK on the 25/11/2008, this was then superseded by 2011/5976 being OK’d on 29/7/2011. It would seem it has taken them all this time to get their act together and you have to wonder if there has been any environmental changes since they received the OK in July of 2011.
Lets face it if those who are saying things are changing daily and we are fast reaching doomsday then it would not be surprising if the environment conditions have altered and maybe what were endangered species in 2008 and 2011 may now be on the verge of extinction – so maybe it would be worthwhile pointing this out the the authorities and seeking to have new in-depth environmental studies undertaken again – just to ensure the environment will not be damaged – after all isn’t that what we are meant to be saving with all these turbines?
With respect to the Wandoan Battery, AGL maybe a bit ahead of themselves announcing this as there doesn’t seem to have been an EPBC approval yet sought for the Solar Plant nor the Battery. Then maybe they expect to have each of these automatically approved therefore its a foregone conclusion they will be built!
Whatever happens Qld like other States is being torn apart by these monster projects destroying the peaceful environments people crave, the health of humans and the environment and all for little effect on the climate but a huge impost on the pockets of everyday Australians and their Governments ability to fund IMPORTANT things like Hospitals, schools, roads, rail, care of National Parks, job training as well as other things like defence and yes even being able to afford to offer more international aid when and where needed.
When will this nightmare end, when will our Federal and State Governments accept the past decade or so has been a failed experiment pushed by those with deep pockets and decaying brains.
I’d like to use your info about the Coopers Gap project in relation to the http://www.forestwind.com.au proposal. I’m an old bloke & you have a research ability that I don’t & would rather your permission than not.
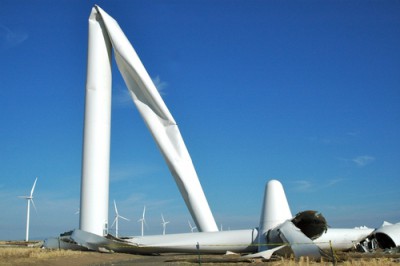
If you download the Boom Logistics Annual Report 2019, pages 10-11 indicate how much land is cleared for turbine construction. The concrete foundation may incorporate replaced and failed blades from VIC & SA (unknown from NSW) with the Bisphenol A, banned in the European Union and Canada.
The American Society of Mechanical Engineers http://www.asme.org/ did a report in June 2019 with a graph listing deaths per TWh for various energy sources as; nuclear 0.04, wind 0.1, solar 0.15, hydro 1.4, gas 4, peat 12, biomass 12, oil 36, coal 161.
This doesn’t take into account long term deaths from carcinogenic exposure such as the 2009 BP Solar factory fire in Bürstadt, Germany – info disappeared from internet.
BP Solar did a runner just like James Hardie Industries in AU with the asbestos fund.
Lang Hancock operated asbestos mines (dangers known since 1928), when asked to comment in the 1970s he said, “Some must die so others may live.”
QLD Hinkler electorate’s Kieth Pitt is also in the sports rort.
Reblogged this on Climate- Science.press.
Two news items: “One of Australia’s largest batteries will be built in southwest Queensland. The battery will be the same size as the giant Tesla battery that powers the South Australia grid. The lithium ion battery, to be built at Wandoan, about five hours northwest of Brisbane, could power up to 57,000 homes. Work on the battery energy storage system will start in July following a deal signed by AGL Energy and Vena Energy Australia yesterday.”
The first mention I’ve seen. There are no and, ifs, or buts, it’s a done deal. Shut-up and take it! Wandoan is further northwest from the Boom Logistics erection of 56 turbines with a capacity of 453MW to power aprox., 264,000 average AU homes at Cooranga North, between Dalby and Kingaroy. See https://stopthesethings.com/2019/11/01/rein-ed-in-norways-reindeer-herders-revolt-against-big-wind-industry-rollout/#comment-483124
Also Forest Wind as part of a consortium: See https://stopthesethings.com/2020/01/21/sunset-industry-us-taxpayers-liable-as-giant-solar-thermal-power-plant-crescent-dunes-goes-bankrupt/#comment-493429
are to hold “COMMUNITY INFORMATION SESSIONS” Kia Ora 4570(postcode) 8 Feb, Tinana 4650 (next to Maryborough) 8 Feb, and Poona 4650, 9 Feb, both Poona and Kia Ora are small communities in the middle of nowhere.
Previously stated as being in a pine plantation, between Gympie and Maryborough, it is now said to be a ‘proposal’ in “the plantation area of the Toolara, Tuan and Neerdie State Forests” unless I’m confused and mistaken, that’s three different forests. With Queensland’s Minister for Natural Resources and Energy, Dr Anthony Lynham and State Development Minister Cameron Dick in support, it’s another steam roller done deal.
Forest Wind contact details are T: (07) 5447 1472 E: info@forestwind.com.au & http://www.forestwind.com.au The region Wide Bay is something of a misnomer, as most of it is inland covering 6 state electorates and 4 federal ones.
These turbines as with Boom Logistics’ will be 160 metres high with 60 metre blades of 20 tonnes each; the ones that like to fall over when transported.
So far there is no mention as to how involved government is in respect to subsidies and such.
As these projects will be part of the eastern electricity grid, it really can’t be said they are confined to a state boundary; just as the months of bushfires became a federal and international matter. Perhaps it’s time that all necessary life support systems were taken from state’s money making hands, such as Queensland’s electricity supply, and relegated to the federal government as part of a national defence provisional system.
The Boom Logistics project appears to have escaped publicity during the proposal stage, unless it was just mentioned to the few local residents – as mentioned, being connected to the eastern grid makes it a national matter trying to be confined to the knowledge of a few local communities who know little of the vast subsidies and lack of information on spontaneous combustion, lack of plans for end of life disposal, blade separation, or even where these turbines are made. It’s easy to hooray about temporary construction jobs in regions of highest national unemployment such as Wide Bay, but it does nothing for the long term future – the exit of manufacturers from South Australia is a case in point.
As long as politicians are getting bulging hip pockets (historian Carrol Quigley had it right back in 1966) the destruction of future economic certainty is not an accident, but most can’t comprehend such Malthusian intent exists.
Also anyone who manages to get anti renewable info into the local media are hit with multiple propaganda stories, in this case, from an EV manufacturer and Forest Wind.
It’s interesting that since the 1970s many AU industrial users of steam boilers, converted from coal to natural gas.
Could STT perhaps provide a list of questions to present to Forest Wind and all the politicians who’s electorates will be subject to another big battery and the wind farm proposal?
Sorry my error, current AU turbines according to Boom Logistics are 180 metres high, 20 more than 160 metres.