
The prospect of a 100% renewable energy future is 100% pure, unadulterated myth. Placard waving teens fretting about the weather in 30 years’ time might demand it, but logic, physics, meteorology and economics will forever conspire against an all wind and sun powered future. And the idea that a transition to wind and solar is ‘inevitable’ is complete and utter nonsense.
Dr. Lars Schernikau is an energy adviser who has worked across Asia, Europe, Africa and the Americas. Lars finished his PhD on the economics of energy, commodities, and the global coal business and published two industry trade books (Springer, available on Amazon) in 2010 and 2017.
Here’s a summary of his key findings:
- Costs for renewable power generation have dropped fast, but they will not improve 10-fold anymore… physical limits will be reached
- Common comparisons of renewables vs. conventional power generation are misleading. One cannot compare marginal costs for intermittent power with costs for base power
- Adding wind and solar to the power grid beyond a certain point is not only uneconomical but hurts the environment
- Gas’ GHG emissions from production to combustion are essential the same as coal, replacing coal with gas will achieve nothing but increase costs
- The material needs and the environmental impact of today’s renewables far out-shadow those for conventional power
Now, here’s the detail on why wind and solar can never power the planet.
Why today’s renewables cannot power modern civilization
Watts Up With That?
Dr. Lars Schernikau
17 September 2019
“The reason renewables can’t power modern civilization is because they were never meant to. One interesting question is why anybody ever thought they could.” (Forbes, May 2019).
The world today is inhabited by close to 8 billion people and we feed our hunger for power to almost 80% with hydrocarbons (coal, gas, oil). Wind and solar make up an estimated 2% of 2017 primary energy, the remainder largely comes from nuclear, hydro and some biomass. Only a 100 years ago we were 2 billion people. Of today’s 8 billion people there are at least 3 billion with no or only erratic access to power… and global population will increase by another 3-4 billion within the next 50 years.

Figure 1: Graph on global energy [1]
Now look at Figure 1 and extrapolate to the future. Do you believe that non-hydro renewables wind and solar will give us the energy we need? Can they sustainably and environmentally friendly power the future?
Solar and wind power are not new. However, over the decades we have improved their efficiency. The Betz Limit states that a blade can capture maximum 60% of kinetic energy in air – modern windmills have reached 45%. The Schockley-Queisser Limit states that at maximum 33% of incoming photons can be converted into electrons in silicon photovoltaic – modern PV reaches 26%. “The era of 10-fold gains is over”[2]. There is no Moore’s Law in energy. It is time that we are take a whole-system view when looking at solar and wind.

Figure 2: Global prices for power – power in Germany is the most expensive [3]
Wind and solar are inherently intermittent means for power generation. They only work when the wind blows or the sun shines. We need to account for the cost of batteries or the cost of conventional power as backup for wind and solar when comparing the cost of power. None of the current Levelized Cost of Electricity (LCOE) measures account for this. Neither do standard LCOE measures account for (1) the additional cost of interconnections required, nor (2) the cost of managing networks with highly volatile energy inputs, nor (3) the efficiency losses resulting from keeping coal, gas, or nuclear power as backup. Number (3) is interesting and actually explains why the total cost of power goes up the more wind or solar you install beyond a certain point. What that certain point is depends on the country and region, but one thing is sure: Germany is beyond that point, illustrated by their high-power prices (Figure 2).
Only recently has the IEA developed a new way of measuring cost of electricity with what they call Value-Adjusted Levelized Cost of Electricity (VALCOE). In February 2019, the IEA writes “In India … using VALCOE… as the share of solar PV surpasses 10% in 2030, the value of [solar] daytime production drops and the value of flexibility increases.” Figure 4 below illustrates the misleading cost comparisons that the current LCOE would give vs. the more correct VALCOE.

Figure 3: Levelized cost of electricity (LCOE) and value-adjusted LCOE (VALCOE) for solar PV and coal-fired power plants in India [4]
Germany has become aware that they need conventional power despite its huge wind and solar capacity installed (Germany’s installed wind and solar capacity by the end of 2018 was 59 GW for wind and 46 GW for solar or 51% of total German capacity; Germany’s wind and solar share was 17% for electricity and only 4,6% for primary power in 2018[5]). You might have heard that Germany decided to exit coal power in addition to exiting nuclear. Wind and solar will not suffice, thus Germany decided to build new gas-fired power plants instead. We know that gas is typically more expensive than coal, more difficult and expensive to transport than coal requiring pipelines or LNG, and generally more difficult and sometimes dangerous to store. What is the reason that Germany shuts down its existing coal-fired power plants and builds new gas-fired ones? Correct, the reason is green-house gas emissions. It is a very well-known fact that gas emits about half the CO2 per kWh during combustion than coal.
What appears to be a less-known fact is that gas emits/leaks methane (a 28x more powerful green-house gas than CO2 over a 100-year horizon and 84x more potent over a 20-year horizon6) during production and transportation. This has been documented in several studies including Poyry 20166. Figure 4 illustrates this fact and compares direct emissions (direct = during combustion) with indirect emissions (indirect = during production and transportation):
- Gas emits about half of CO2 compared to coal during combustion
- Gas emits more CO2eq. (mostly in form of methane) during production and transportation
- Total gas CO2eq.emissions are on par with coal, depending on the type turbine and the location of the power plant
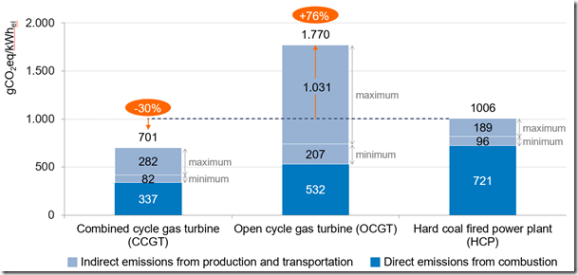
Figure 4: Coal vs. natural gas – green-house gas emissions during partial load operation [6] Note: CO2eq Emissions for LNG or shale gas are significantly higher than for pipeline natural gas (PNG)
Batteries have become far more efficient and the recent move towards electrical vehicles has driven large investments in battery “Gigafactories” around the world. The largest known and discussed factory for batteries is Tesla’s USD 5 billion Gigafactory in Nevada which is expected to provide an annual battery production output of 50 GWh by 2020. Such factories will provide the batteries for our world’s electric vehicles and are supposed to provide backup batteries for houses (see Tesla’s Powerwall) [6].
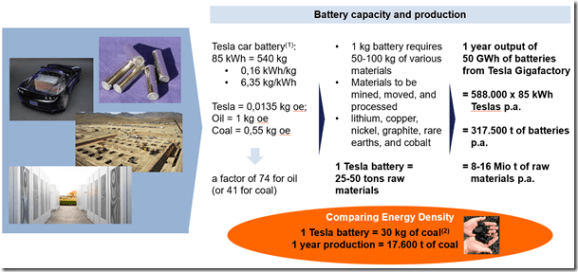
Case in point: Tesla‘s batteries – energy density & environmental impact [7]
Figure 5 summarizes the environmental challenge of today’s battery technology. The problem with any known battery technology has to do with two main issues:
- Energy density
- Material requirements
Energy density: Hydrocarbons are one of the most efficient ways to store energy. Today’s most advanced battery technology can only store 1/40 of the energy that coal can store. This already discounts for the coal power plant efficiency of about 40%. Energy that a 540 kg 85 kWh Tesla battery can store equals the energy of 30 kg of coal. The Tesla battery must then still be charged with power (often through the grid) while coal is already “charged”.
In addition, you can calculate that one annual Gigafactory production of 50 GWh of Tesla batteries would be enough to provide backup for 6 minutes for the entire US power consumption. Today’s battery technology unfortunately cannot be the solution of intermittency.
Material requirements: Next comes the question of the inputs and materials required to produce a battery. It is expected and conservatively calculated that each Tesla battery of 85 kWh requires 25-50 tons of raw materials to be mined, moved and processed. These required materials include copper, nickel, graphite, cobalt and some lithium and rare earths. We will likely also need some aluminum and copper for the case and wiring. Additionally, energy of 10-18 MWh is required to build one Tesla battery, resulting in 15-20 t of CO2 emissions assuming 50% renewable power.
I am not even considering the overburden that needs to be moved for each ton of minerals mined. The overburden ratio can be estimated 1:10. Thus, you can 10x fold the numbers above. One Tesla battery requires 500-1.000 tons of materials to be moved/mined compared to coal which requires only 0,3 tons – a factor of 1.700 to 3.300!
This article cannot discuss the details of global warming. However, it is very worrying that young people are taught in school to fear the warming created by fossil-fuel burning. We had 1 degree of warming in the past 200 years. The “human cause” has much more to do with the heat that our existence (energy consumption) produces and releases to the biosphere rather than with CO2. The majority of warming is natural, caused by the sun as we are coming out of the Little Ice Age that ended about 300 years ago. We are not heading into a catastrophe, but we need to worry about real pollutants to our environment and the waste we create. This is where we should focus our attention and spend our resources.
Wind and solar – while certainly being appropriate for certain applications such as heating a pool, and thus earning a place in the energy mix – cannot and will not replace conventional power. We need a “New Energy Revolution”. To reach this New Energy Revolution we need to invest more in base research and at the same time invest in, not divest from, conventional power to make it efficient and environmentally friendly.
Notes and Sources
- [1] Primary electricity converted by direct equivalent method; Source: Data compiled by J. David Hughes. Post-1965 data from BP, Statistical Review of World Energy (annual). Pre-1965 data from Arnulf Grubler, “Technology and Global Change: Data Appendix,” (1998).
- [2] Mark Mills “The New Energy Economy”, Manhattan Institute, March 2019
- [3] This statistic shows electricity prices in selected countries worldwide excl VAT; Source: Statista 2019, Release Date October 2018
- [4] IEA; WEO Analyst; February 12, 2019 by Brent Wanner
- [5] Frauenhofer ISE 2018 reported in Clean Energy Wire April 2019
- [6] CCGT operation without bypass (incl. operation of the steam turbine); Source: Poyry 2016; German Study on “Comparison of greenhouse-gas emissions from coal-fired and gas-fired power plants”
- [7] Note: 1 kWh = 860 kcal = 0,086 kg oe = 3.600 kj; 1 kcal = 4,1868 kj; 50 GWh = 50.000.000 kWh = 317.500 tons batteries
- Tesla‘s Powerwall has a usable capacity of 13.5 kWh and weighs with frame 125 kg. Assuming 100 kg is net battery weight this means 0,135 kWh/kg, so even less effective than Tesla‘s battery
- Tesla battery 90% efficient = 76,5 kWh; assuming 5.500 kcal per kg for coal, 40% power plant efficiency to generate 76,5 kWh requires 191 kWh or about 30 kg of coal
Sources: Author‘s Analysis and Research based on Mills “The New Energy Economy, an Exercise in Magical Thinking“, Manhattan Institute March 2019; Matthew R. Shaner et al., “Geophysical Constraints on the Reliability of Solar and Wind Power in the United States,” Energy & Environmental Science 11, no. 4 (February 2018): pp 914–925, pictures taken from: https://www.tesla.com
Watts Up With That?


Reblogged this on ajmarciniak.
The following story, though it doesn’t directly mention wind power, has the ring of subsidies needed for low wind days. Worth investigating if you’re not already on it.
https://www.reuters.com/article/us-energy-eu-capacitymechanism-exclusive-idUSKBN1WJ1G4
P.S. But citing Anthony Watts and other climate-deniers does the movement no good.
Did Watts deny the climate exists? Sounds unlikely. In fact we have never heard anyone say there is no climate.