
Talking about wind and solar capacity is like pointing to a giant bucket, with a whole in its bottom; what’s promised and what’s delivered never match. The consumption of electricity is a here and now kind of thing. No one cares about how many windmills and solar panels there are, only that power is delivered as and when they need it.
The image above is the combined output of every wind turbine connected to Australia’s Eastern Grid (with a capacity of 6,702 MW) during June.
A nine-year-old could tell you that what’s depicted is the archetype of weather driven chaos. And yet, there are still plenty of politicians and journalists who pretend that we’re a heartbeat away from an all wind and sun powered future. No country has ever run itself on wind and solar; no country ever will. The figures collected by David Bidstrup below tell the story.
Are we really “power poor” or are we just stupid?
Catallaxy Files
David Bidstrup
7 August 2019
The latest “Weekend Australian” carried an article by Alan Kohler titled “Why we’re power-poor but renewables rich” in which he extolls the virtues of renewable energy and mentions the swags of projects ready to add “Gigawatts” of capacity that will keep the lights on and the planet safe.
If we look past the mania about “dirty coal” and consider the resources we already have that are “reliables” the picture does not look bleak at all.
Some time ago I was fortunate enough to get the 2018 generation figures for all AEMO registered generators, (thanks Andrew Miskelly), and I did some analysis.
The table below lists the salient points:
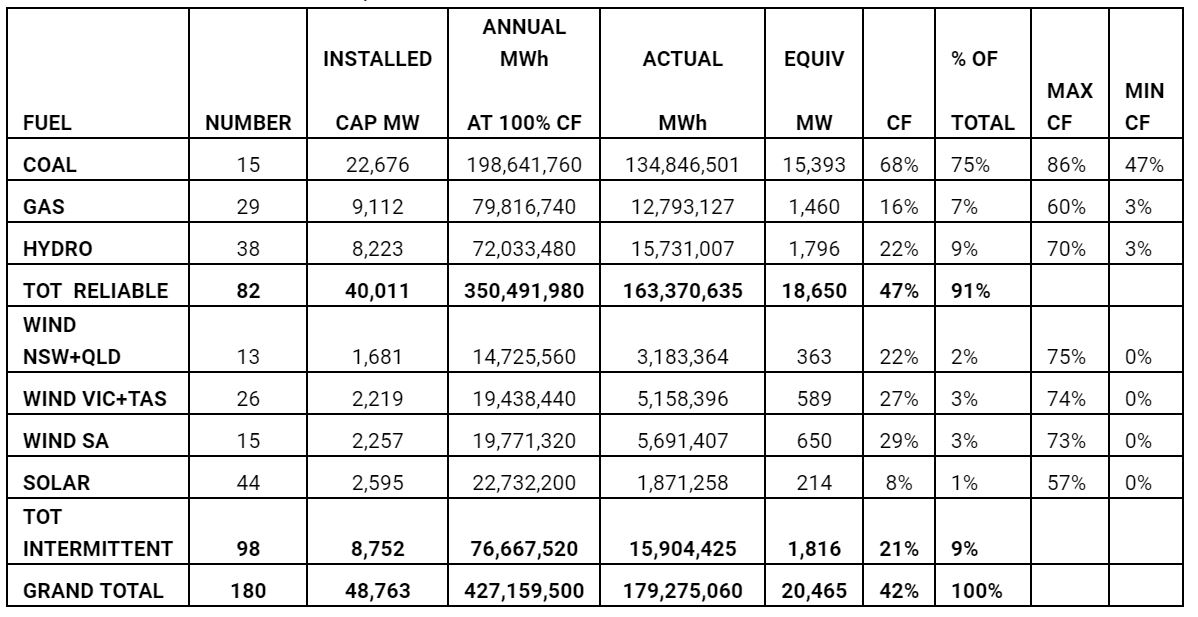
With the “reliables” the number to look at is the capacity factor, (CF). CF is a measure of how much of the theoretical 100% capacity is utilised. Coal, gas and hydro could be expected to be able to achieve 80% allowing for maintenance outages but they show CFs of 68, 16 and 22% for an overall CF of 47%.
With the “intermittents” the CF is what you get due to the vagaries of sun and wind whereas the “reliables” can be run at any time so output is predictable. Here the CF ranges from 8% for solar to 22 to 29% for wind. The table shows the contribution to annual energy consumption by the various types. Coal contributes 75%, gas 7% and hydro 9% for a total “reliable” of 91%. The “intermittents” contribute 9%.
The chart below is the demand for January 18 and 19 2018, the day of the highest demand on the AEMO grid in 2018. The figures come from the AEMO price and demand files and it is a combination of all states. The data is given in 30 minute intervals so the X axis has 98 points, one for each half hour over 2 days.
I have used the “reliables” at a CF of 80% and plotted the required contribution from each to meet the demand curve. The maximum demand on 18 January was 30,439 MW and on 19 January was 31,221 MW. The blueish area is the coal, the next bit is coal and gas and the greenish peaks are coal, gas and hydro combined. The shape of the curve is the actual demand curve for each day.

The conclusion is that on the days of the greatest demand in 2018 the “reliable” power generators could have handled the load at 80% CF. Just out of interest the table below gives the relative contributions in MWh for each type to meet the demand curve. There is no need to have any “intermittents”.
| TOTAL MWh | COAL | GAS | HYDRO |
| 1,186,763 | 844,800 | 259,118 | 82,845 |
| 100% | 71% | 22% | 7% |
Remember this is using 80% of the “installed capacity” so there is some up the sleeve provided that the generators can get their acts together and have the plants up to speed before summer.
Kohler’s article mentions that there are 96 GW, (96,000 MW) of “intermittents” on the drawing board. Using the cumulative CF of 21% this is only 20GW on an annualized basis and it is all “intermittent”.
The first table shows some maximum and minimum CFs for the “intermittents”. Wind varies from around 75% to zero and solar 57% to zero but they are chaotic.
The starry-eyed greenies and the renewables carpetbaggers will be the only beneficiaries of this insanity and consumers will be shafted some more.
Reliable coal power stations will close to satisfy an irrational fear of “emissions” and the grid will teeter on the precipice, particularly in summer. The days of maximum demand used in the charts are also the days when spot prices reached the limit of $14,500 per MWh and we will get it again next summer.
We are not “power-poor” at all; we just trash good systems for the “benefit” of the planet and the pockets of the carpetbaggers.
Just today a new project was announced for SA that will have 125 MW of wind, 150 MW of solar for an additional 55 MW on an annualized basis, and a battery capable of storing 400 MWh.
At maximum demand 400 MWh is 0.8 minutes of grid consumption. The cost is $500 million and the local pollies think it is a marvelous idea. If the $500 million was spent ensuring the current coal plants were maintained properly and run intelligently there would be no need for this “intermittent” madness.
Catallaxy Files

That table really says it all about installed capacity compared to the penetration it made to the grid. Do you have any figures on what Australia has spent on wind and solar in the last 20 years? I’ve heard people quote around $50 billion but I’m not sure if that’s total renewables – including hydro – or whether or not it includes subsidies as well.
Bradley, the capital spend on wind and large scale solar and domestic solar approaches the $50bn you mention.
The subsidies under the LRET are dealt with here
Thank you, appreciate your work.
Reblogged this on ajmarciniak.
Does anyone have any idea why the capacity factors for coal gas and hydro are so low? I hypothesise that coal is low because of plants offline for maintenance/repair (or priced out by the wind on the days when the winds actually blow). I hypothesise that in a drought there simply is not the water available to turn the turbines at the dams. But gas? 16% seems very low. Any idea why?
Now for the new SA “investment”, what I’ve been reading over the last six months is that the Tesla battery from a few years back was never meant to act as a “battery” (ie a reserve of power for use when the sun is not shining and the wind not blowing), but it was purchased to sort out transients in the network and keep the voltage steady. That is not how I remember it initially being spruiked, but that is the current story, Don’t be surprised if this new one is justified on the same basis. I believe that if we had reliable coal / gas / nuclear, instead of erratic wind and sun, the voltage problem would not exist and these expensive devices would not be needed.
You are correct about the capacity factors for coal fired plants. They lose priority when they are underbid by subsidised wind and solar, and stop delivering power to the grid. The plants continue to burn coal because they are scheduled and must remain ready to dispatch. This is why they are being driven out of the market.
What you are saying, I think, is that coal furnaces can’t just be shut off when the wind decides to blow. And then lit back up again when the wind dies down for a few minutes.
So when the wind blows, we’re still burning coal. No WONDER solar/wind cost so much! Because we have to keep BOTH going.
Thanks a great post as usual. If you look at july/august you will find that from 26th july until 5th august wind provided from around 1% to 20% and never more……thats a very long time with little output and makes a mockery of snowy 2.0 and 7 days of 2Gw capacity if “fully charged”. How many wind farms will it take to power the country and provide storage…we will need all of Kohlers 90Gw and more i reckon!
In an article in The Australian in mid 2015 about battery technology Alan Kohler commented thus about the charging a Tesla S electric car “You’d probably charge it every night like the mobile phone.” The Tesla S 70D battery, with its 70kWh capacity, is somewhat larger than your average mobile phone battery, about 15,000 times larger in fact. So I don't think I'd treat Kohler's comments about battery technology too seriously Toby?