
With the wind always blowing somewhere, it’s claimed that if turbines are spread far and wide, there’ll be a constant supply of wind ‘energy’. Except whole countries and indeed vast tracts of whole continents face dead-calm weather on a routine and regular basis.
South-eastern Australia is home to 5,000MW of wind power capacity, spread across four states (NSW, Victoria, Tasmania and South Australia), which often struggle to produce more than 5% of that figure for hours, and sometimes days on end.
The same phenomena applies right across Western Europe, as detailed by Roger Andrews below.
Quantifying wind surpluses and deficits in Western Europe
Energy Matters
Roger Andrews
7 November 2018
This posts updates my January 2015 Wind blowing nowhere post using 2016 rather than 2013 data. The 2016 data show the same features as the 2013 data, with high and low wind conditions extending over large areas and a decreasing level of correlation with distance between countries. The post also quantifies the surpluses and deficits created by high and low wind conditions in January 2016 in gigawatts. The results indicate that wind surpluses in Western European countries during windy periods will be too large to be exported to surrounding countries and that wind deficits during wind lulls will be too large to be covered by imports from surrounding countries. This casts further doubt on claims that wind surpluses and deficits in one region can be offset by transfers to and from another because the wind is always blowing somewhere.
2016 Wind Generation:
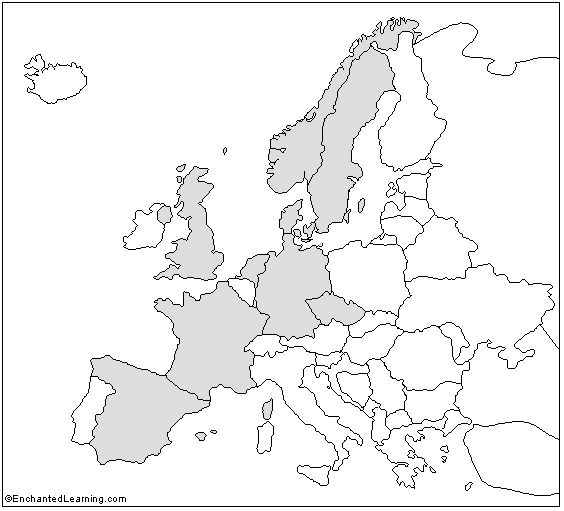
The wind and other data used in this post are from the P-F Bach database used in “wind blowing nowhere”. Three of the countries for which 2013 data were available – Finland, Ireland and Belgium – have no 2016 data, but three countries that had no 2013 data – Norway, Sweden and the Netherlands – do. As a result we now have a contiguous block of nine countries that extends from Gibraltar to North Cape, a distance of 4,400km, and which has a width of up to 1,900 km (Figure 1). The total area covered by the nine countries is 2.66 million sq km:
Wind capacity factors by country are shown in Figure 2 (click to enlarge). Capacity factors instead of actual generation values are plotted to avoid swamping countries with low levels of wind generation with generation from large producers, and daily rather than hourly data are shown for readability. Capacity factors are adjusted for capacity additions during the year:
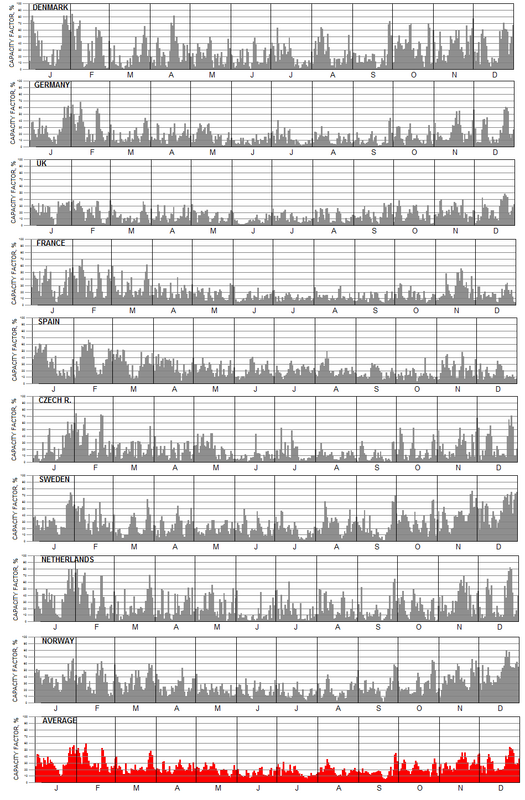
Figure 2 shows a number of cases where wind capacity factors are closely correlated between countries, such as between Germany and Denmark, and others where they are not, such as between Sweden and Spain. Such results would, however, be expected given that Germany and Denmark are next to each other while Sweden is a long way from Spain. I confirmed a correlation-distance relationship for the 2013 data in a graph posted in a comment on “wind blowing nowhere” and got the response shown in Figure 3. It shows the correlation coefficient (R) going asymptotically to zero (i.e. no correlation) at a separation distance of somewhere around 4,000 km:
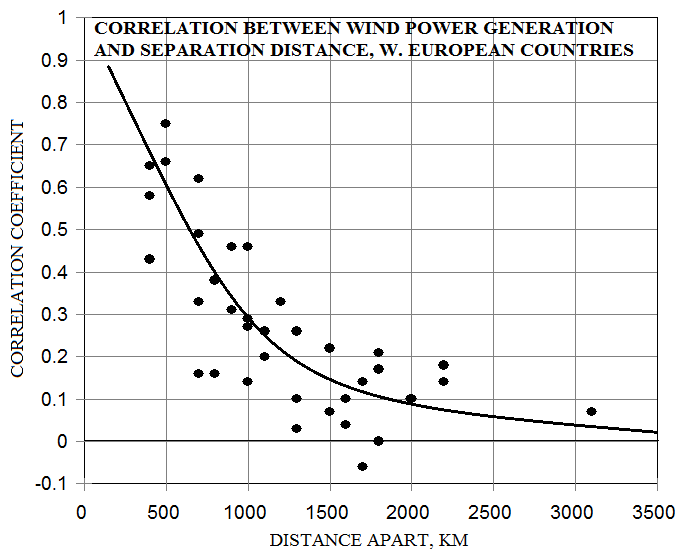
Repeating the exercise using 2016 data gave similar results, but the response was linear:

According to Figure 4 the correlation goes negative at separations of greater than 2,250 km, indicating that adding wind generation from countries more than 2,250 km away will begin to offset rather than reinforce wind spikes and troughs. However, the level of offset will be minimal at low R values. It would be necessary to import power from countries at least 3,000 km away before the offsets became in any way significant, which in practical terms means that Germany would have to import wind power from Siberia, Kazakhstan or Iran to smooth its wind output even minimally.
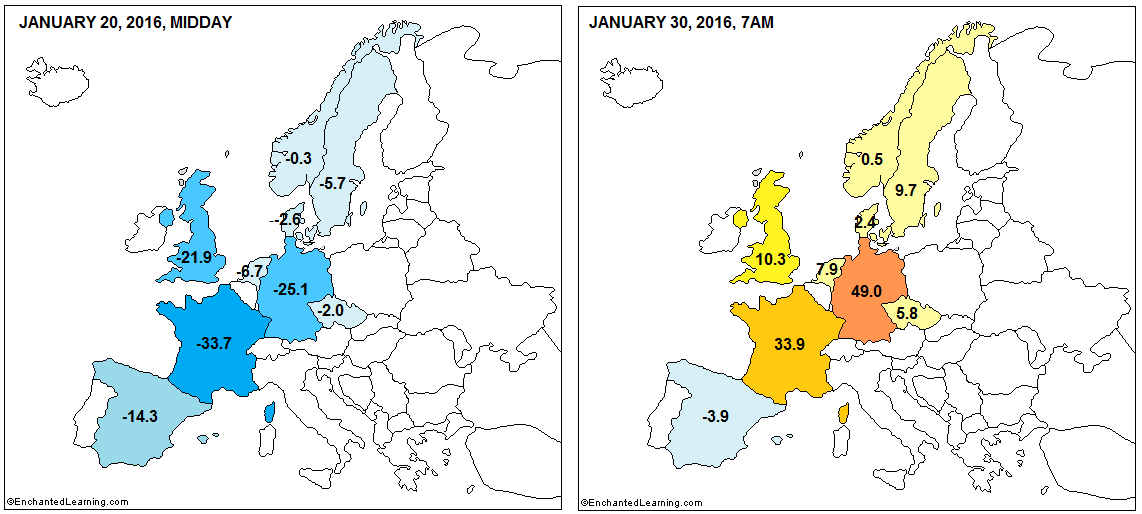
Figure 5 plots wind capacity factors for the two hourly periods in January 2016 where wind deficits and surpluses were largest, as discussed in the next section. The January 20 plot shows capacity factors below or well below average over all of Western Europe, further confirming that when the wind isn’t blowing somewhere it isn’t necessarily blowing somewhere else. The January 30 plot shows capacity factors above or well above average except in Spain, suggesting that when the wind is blowing hard somewhere it will probably be blowing hard in most other places too.

But neither plot provides any information on the magnitude of the deficits and surpluses or which countries contribute the most to them. So on to the next section.
Quantifying wind surpluses and deficits:
To perform this work I inevitably had to make some assumptions regarding the green, renewable Europe of the future. My basic assumption was that 50% of each country’s electricity generation would be supplied by a combination of wind and hydro. This resulted in wind providing 50% of generation in countries with no significant hydro (Denmark, Germany, UK, the Czech Republic and the Netherlands), proportionately lower percentages in Spain (8% hydro), France (12%) and Sweden (41%), and a very low percentage in Norway (95% hydro).
I then selected January 2016 as a sample month and proceeded as follows:
- Adjust the P-F Bach hourly load data so that they account for 50% of total generation in each country during January.
- Adjust the hourly wind and the percent hydro values so that total wind + hydro generation during January equals total adjusted load as calculated in step 1.
- Subtract 1 from 2 to obtain wind surpluses and deficits.
The results for January 2016 segregated by country are summarized graphically in Figure 6. There are occasions where the wind surpluses and deficits balance out (area above the zero line = area below) but for most of the time the plot is in surplus or in deficit. Summing the data for all nine countries shows the largest surplus (115.7 GW) occurring at 7 am on January 30 and the largest deficit (112.3 GW) at midday on January 20:
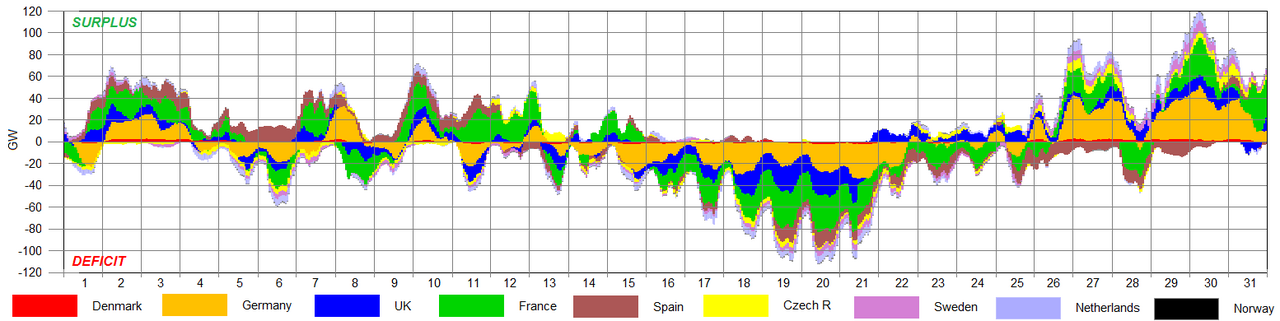
Figure 7 shows individual country surpluses and deficits, in gigawatts, during these two periods:
As would be expected the three largest economies (Germany, France and the UK) contribute much more to the deficits and surpluses than the six smaller ones – between them they account for 81% of the January 30 surplus and 72% of the January 20 deficit. The key issue, however, is magnitude. Could wind surpluses and deficits exceeding 110 GW in Western Europe be balanced out by transfers of wind power to and from the smaller economies of Central and Eastern Europe? Almost certainly not. And if not the January 30 surplus would have to be curtailed, and unless enough backup dispatchable capacity were available the January 20 deficit could black out parts of Western Europe. Note also that the maximum surpluses and deficits would be even higher if intervals shorter than one hour were used.
A second assumption I had to make in order to isolate the wind contribution was that the 50% of generation that comes from sources other than wind and hydro is constant. This of course would not be the case in a green, renewable Europe, where it would be dominantly solar. But a European grid powered almost exclusively by wind and solar is not going to work without some magical technological breakthrough that eliminates the impacts of intermittency, so I felt at least some justification in assuming that the generation would be dominantly nuclear. A 50% nuclear Europe is of course unlikely to materialize at any time in the foreseeable future, but there are no definitional obstacles standing in nuclear’s way. Under the ambiguous criteria adopted in 1987 by the Brundtland Commission nuclear could already be defined as “sustainable” (it’s at least as sustainable as large-scale biomass burning and it doesn’t emit CO2), and if breeder reactors can be commercialized at scale there would be no doubt about it.
The message that emerges from these results is that wind surpluses and deficits in Europe and probably elsewhere are too large to be offset by grid transfers, and adding solar would probably make things worse. This undermines a key assumption made by all “100% renewables” studies except arguably the 2018 Jacobson study, which “assume(s) all-distance transmission.” Via the global solar interconnector, one imagines.
Energy Matters


Reblogged this on "Mothers Against Wind Turbines™" Phoenix Rising….
The low point for wind in Australia (so far) is 2.7% of capacity. Does that mean we should install 37 times the demand in wind capacity? And when the wind blows and 3 or 4 times capacity meets demand, are the rest of the turbines are just shut down without payment?
Reblogged this on ajmarciniak and commented:
With the wind always blowing somewhere, it’s claimed that if turbines are spread far and wide, there’ll be a constant supply of wind ‘energy’. Except whole countries and indeed vast tracts of whole continents face dead-calm weather on a routine and regular basis.
South-eastern Australia is home to 5,000MW of wind power capacity, spread across four states (NSW, Victoria, Tasmania and South Australia), which often struggle to produce more than 5% of that figure for hours, and sometimes days on end.
The same phenomena applies right across Western Europe, as detailed by Roger Andrews below.