
If you live in Australia, and you’re reading this post, you’re doing so thanks to coal. If you don’t like it, shut your device down now. The electricity that’s powering it, your home, the internet, etc, etc isn’t coming from sunshine and breezes. It’s coming from a coal-fired power plant. So, deal with it!
Over 20 years, after more than $20 billion in subsidies to wind and solar, their actual contribution to power demand in this Country remains risible. When power demand peaks, and supply really matters, the trivial amount of electricity offered up by wind and solar is little more than a rounding error.
All those windmills and all those solar panels rarely muster up one whole percentage point, when it counts. Coal-fired power, on the other hand, just keeps on keeping on. Delivering affordable power, whatever the weather.
Here’s a few hard numbers from Anton Lang on just what it is that keeps on powering Australia [for eco-zealots this post comes with a trigger warning: the answer is ‘coal’].
At peak time intermittent renewables often make less than 2% of total Australian electricity
Jo Nova Blog
Anton Lang
25 July 2018
When power is required the most, wind and solar are missing almost entirely. This isn’t cherry picking of one time — peak time is the most important time on the grid, when the most power is required. The almost non-existent contribution from renewables is so common it has occurred now for seven days out of the last 14 days.
I’ve been doing a series on the Australian generation and demand curves on a daily basis for seven weeks, the totals are settling down, so that now the percentage changes are only in tenths of a percent, and consider that when it comes to total power and coal fired power, a tenth of one percent is 600MegaWattHours, so at that end of the scale, small is actually large, if you can see that.
At the moment, after 10 weeks, coal fired power is delivering 72.37% of all power, and wind is delivering only 6.16% of all generated power. I have all the percentages, but those two are the ones of most importance. Wind power has just had a very good week (for wind), but in the end, coal fired power is still delivering more than 3 times the total for every renewable power source in the country.
You might wonder why I haven’t mentioned solar power here, because ALL the solar plants, (not rooftop solar) only generate 0.38% of the required power, so just a tick above nothing at all.
The main evening peak occurs at 5.30 to 6PM, when power consumption is always at its greatest when people come home, cook dinner, throw on the washing and have showers. (Note here the time, 5.30/6PM, so the Sun has set and there is ZERO power from any solar power plant, and also ZERO power from any rooftop solar installation as well). It’s that one point in time when a large supply of power is at its most critical, so now look at this data for seven days of 14 days in the middle of winter. Wind has had a poor time of it lately, due to those High Pressure weather systems hovering over the area where there is the largest concentration of wind plants, hence very little pressure gradients for wind, and they are in South Australia and Victoria.
Here’s a sample of seven of those 14 midwinter days at 6pm peak power time:
- Wednesday 20 June – Peak power – 29680MW. Wind power – 500MW. Total from wind and solar – 1.7%
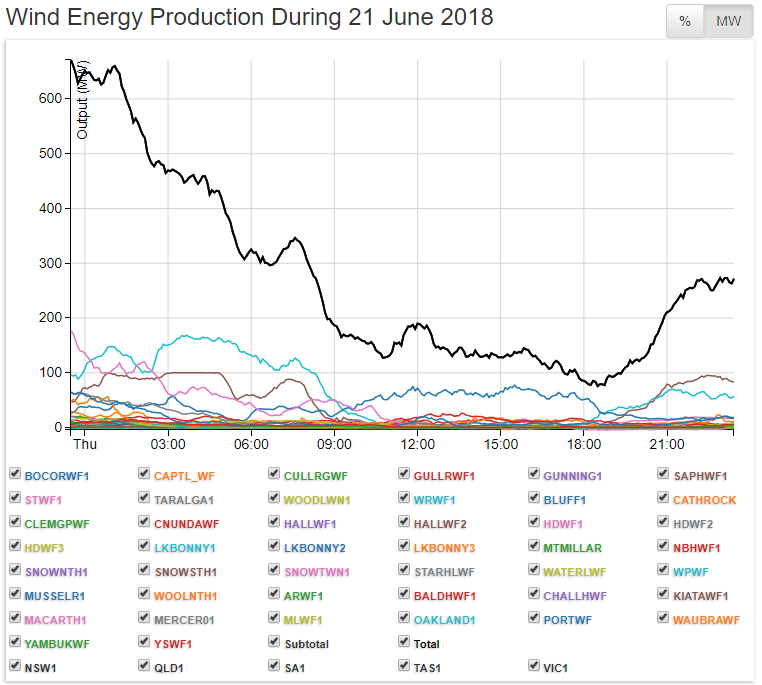
- Thursday 21 June – Peak – 29950MW. Wind – 100MW. Total from wind and solar – 0.33%
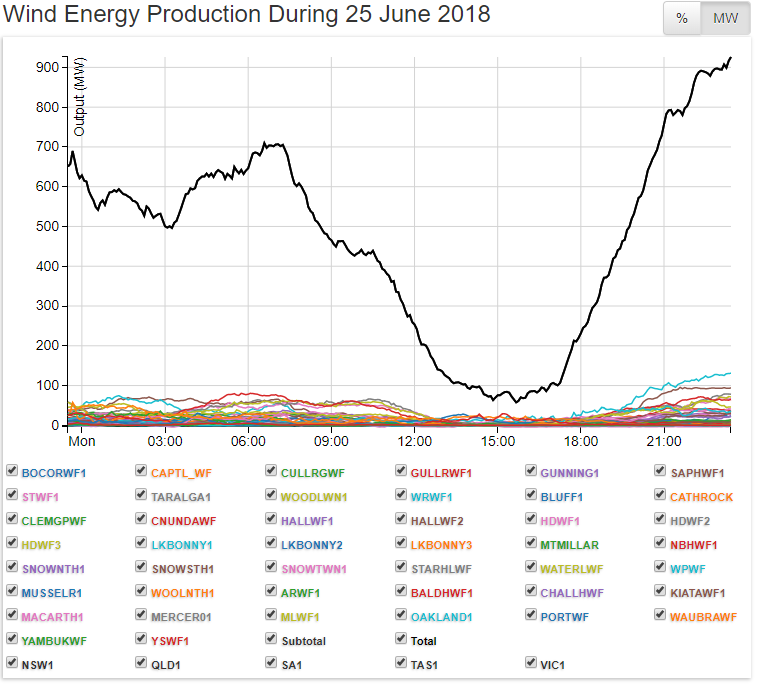
- Monday 25 June – Peak – 30870MW. Wind – 170MW. Total from wind and solar – 0.48%
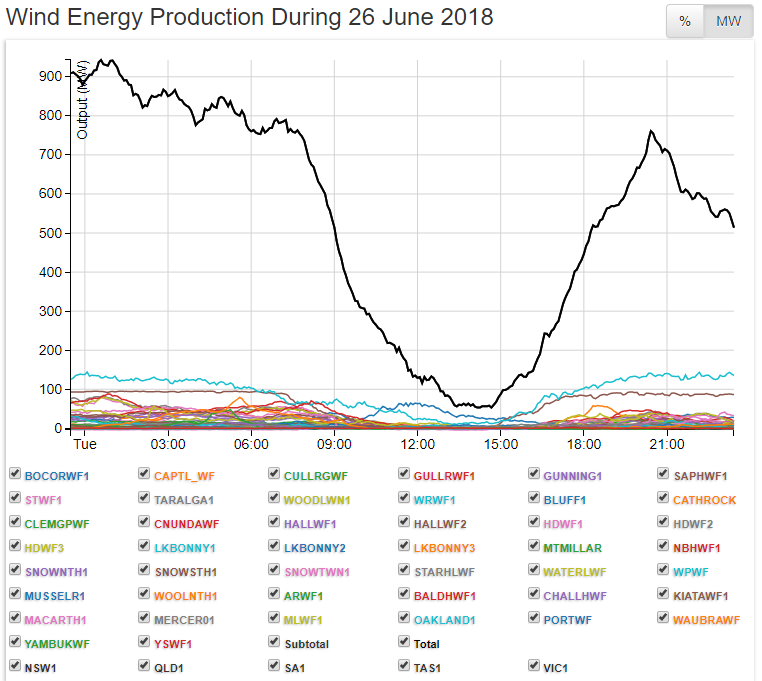
- Tuesday 26 June – Peak – 30600MW. Wind – 340MW. Total from wind and solar – 1.1%
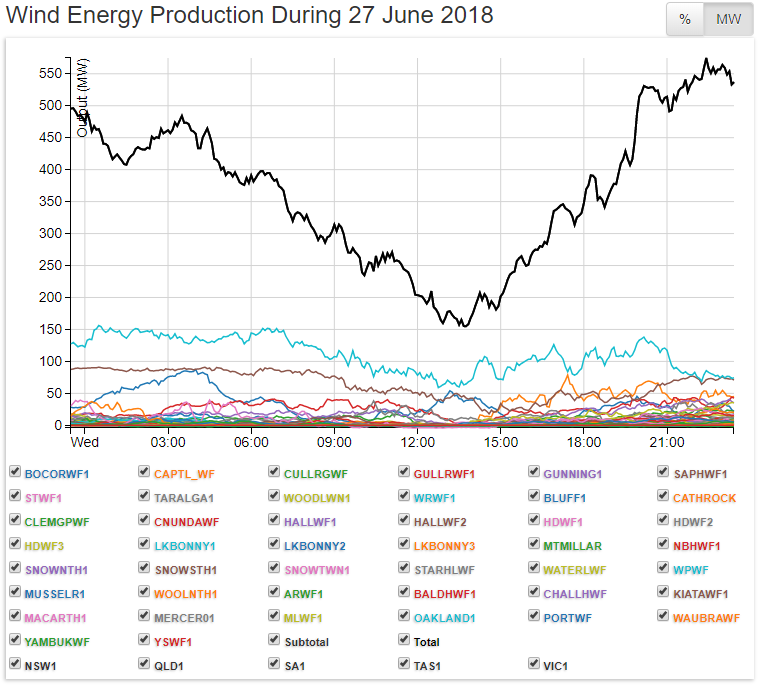
- Wednesday 27 June – Peak – 30480MW. Wind – 340MW. Total from wind and solar – 1.1%
- Thursday 28 June – Peak – 30400MW. Wind – 450MW. Total from wind and solar – 1.5%
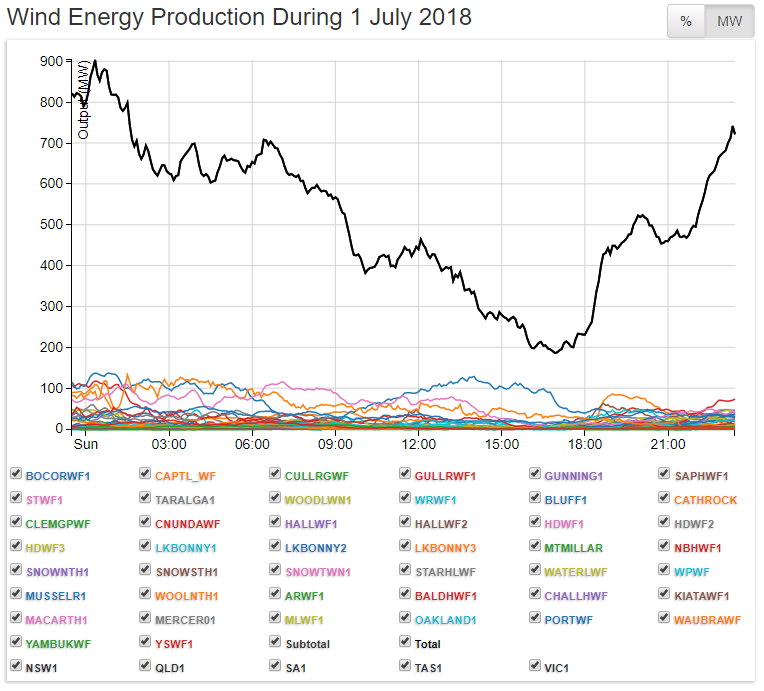
- Sunday 01 July – Peak – 28190MW. Wind – 200MW. Total from wind and solar – 0.7%
There were three other days when it was between 2% and 3%, but these are the seven lowest. This is all wind, as the Sun has set and in winter, solar is useless at 6pm.
So, when power is required the most, wind and solar are missing almost entirely. The point here is that even though the country is consuming the most electricity it actually can consume, on those 14 days, almost ALL OF IT was actually being delivered from coal fired power, natural gas fired power, and hydro power.
From the low point of 0.3% (100MW of that Peak) to the high point of 2%, (600MW) is between one and three units at a gas plant just waiting for the call already to ‘fire up’. The fact that those three main sources have already proved they can handle it is an indictment on the total and utter uselessness of wind power, solar power, and rooftop solar power.
Coal power just keeps going, while hydro and gas are volatile depending on wind generation
There was something I noticed after a week or two of doing it, and that was that whatever wind power did, up, or down, it had no effect at all on what coal fired power was supplying. At first I thought it may have been an anomaly or a short term thing, but after seven weeks now, it is in fact the case.
Wind power varies wildly on a daily basis, but coal fired power just kept delivering within its close range of power generation, no matter what.
What they were using as an ‘adjustment’ factor was natural gas fired power, and also hydro power as well. So, if wind power was up, then those other two were down, and when wind power was down, then those other two were up. And coal fired power stayed (virtually) the same. You might think that (keeping in mind that I said earlier that with coal fired power, big can ‘look’ small) any change would be subject to ‘scale’, but here I’m talking of wind varying by sometimes hundreds and more MW, and the other two the same also, but coal fired power only changed by perhaps one hundred MW up or down, so nothing really. The confirmation came on two days last week, the Thursday and Friday, and look at these figures, and these are the average power delivery per hour across the day.
Thursday coal fired power – 18600MW and wind power – 710MW
Friday coal fired power – 18500MW and wind power 2450MW, and overall power generation was 300MW lower at an average of 25200MW per hour.
So, while overall power consumption was ever so slightly lower, wind power was up by 1740MW , and coal fired power only changed by 100MW, and while this one is the most obvious, all the other changes also reflect very little change for coal fired power when wind power varies so wildly on that daily basis.
TonyFromOz series on daily Australian power supply and demand. The Latest week results, (week 10) and there will be a new one next Monday.
Jo Nova Blog
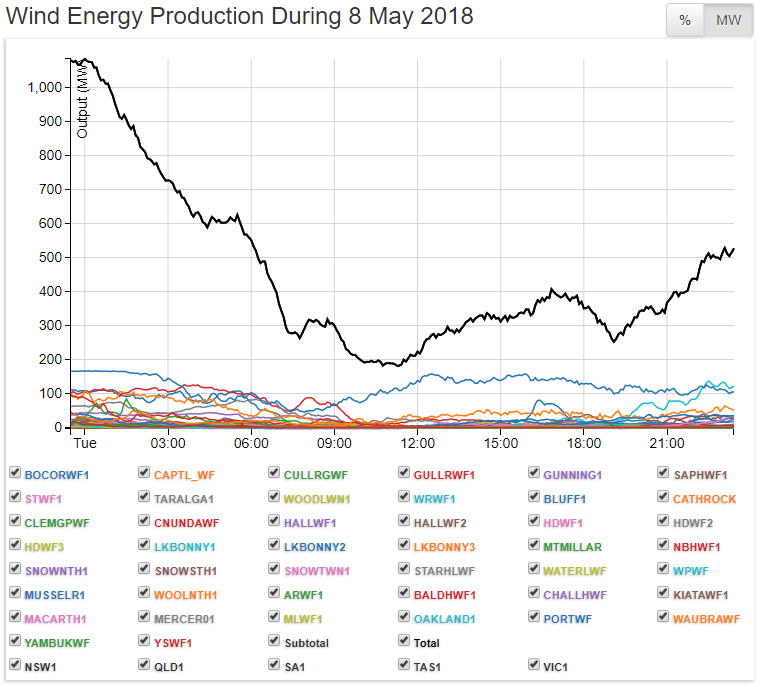
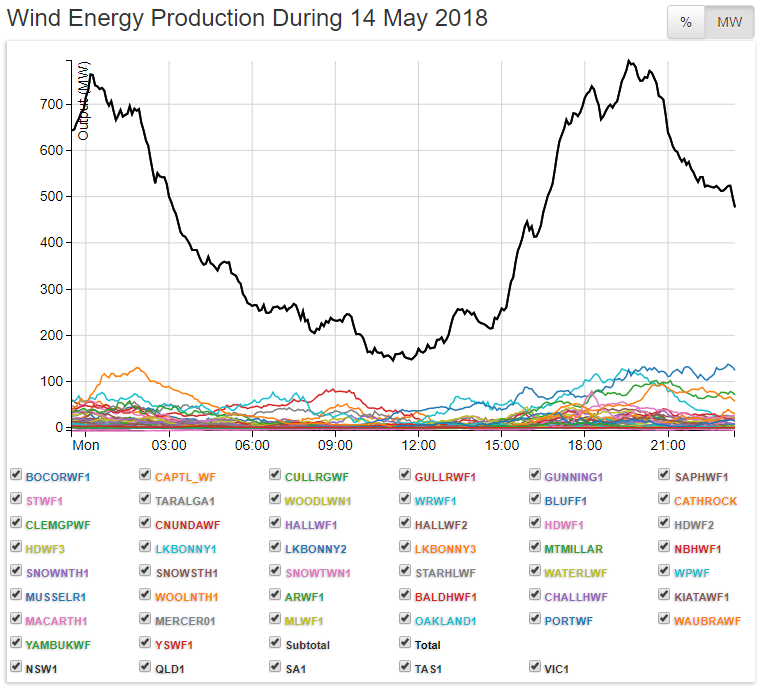
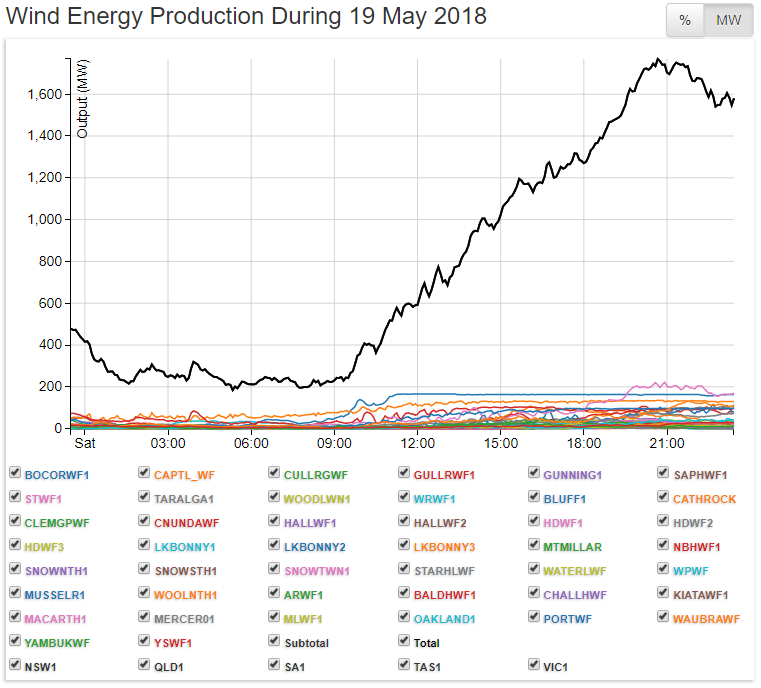
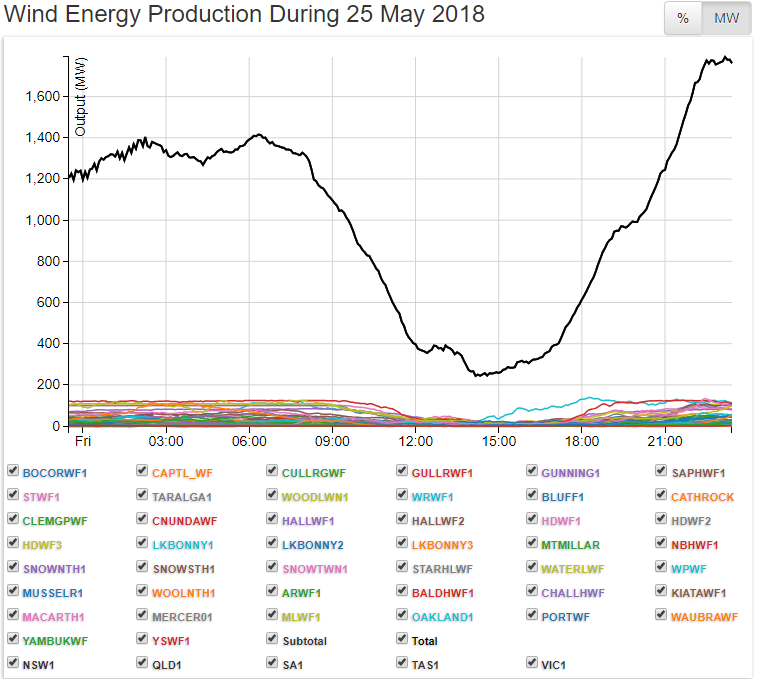
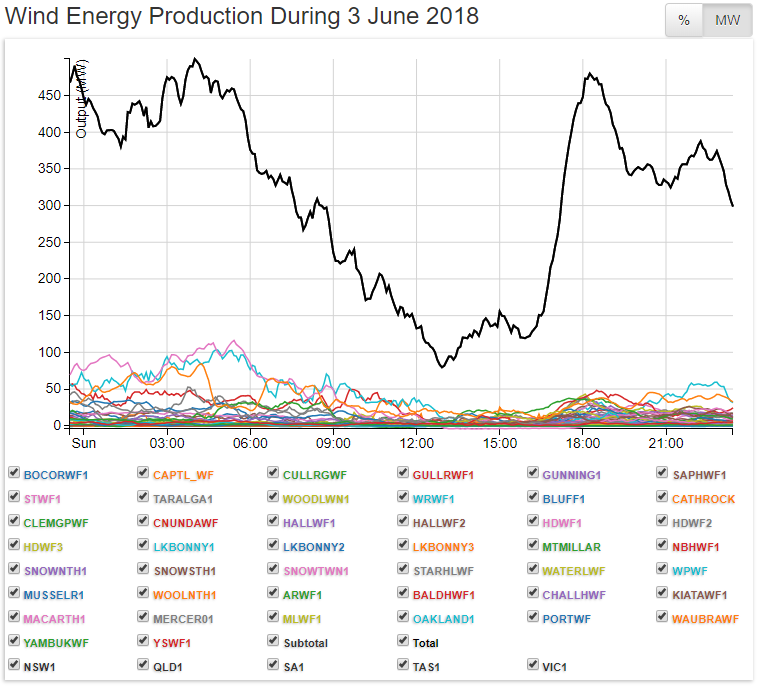
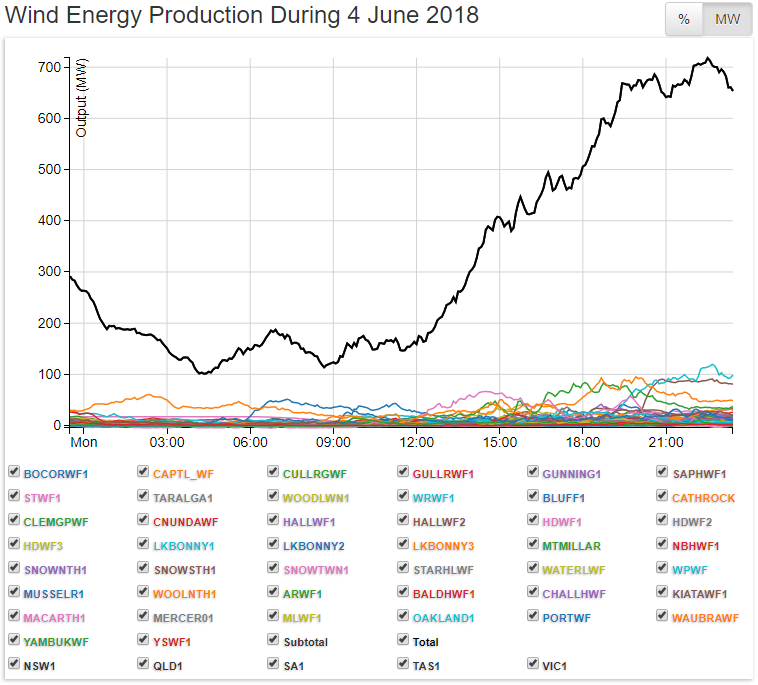
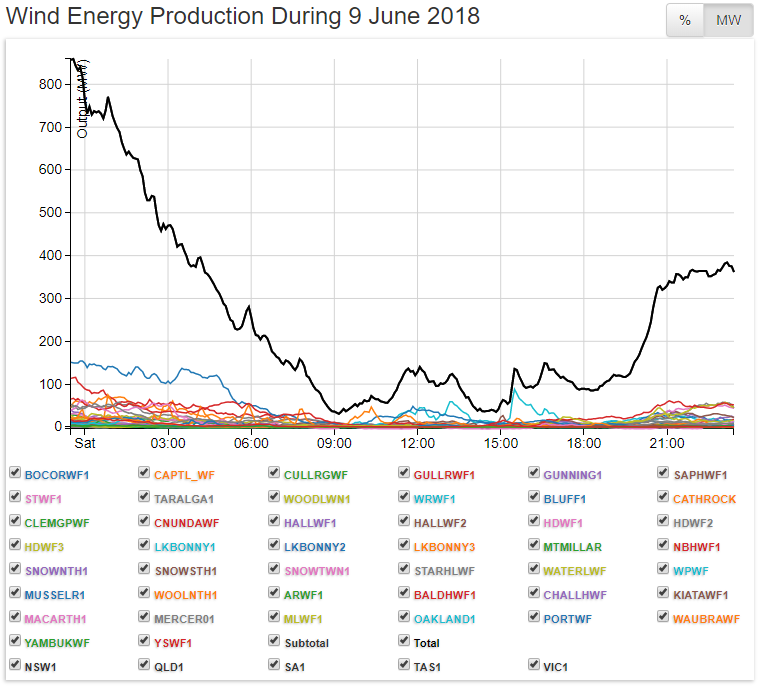
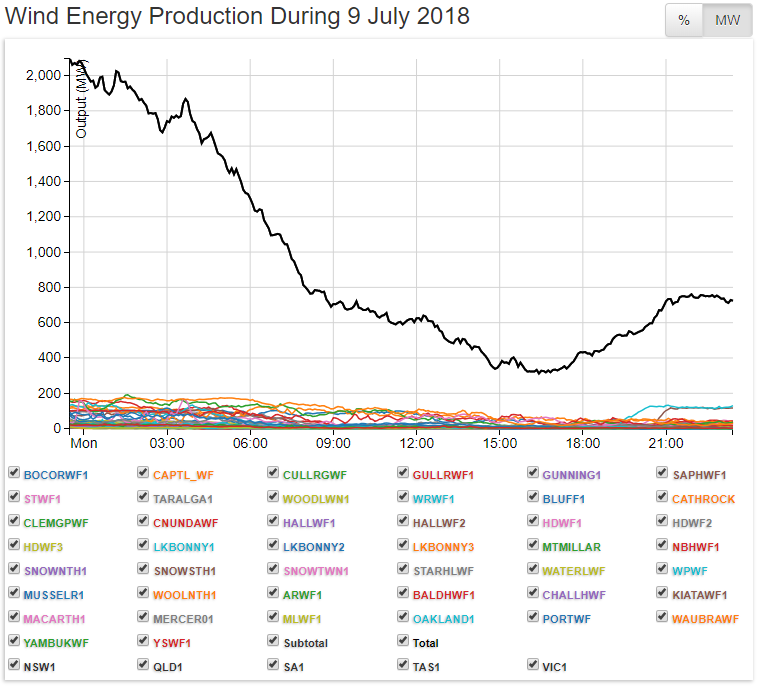
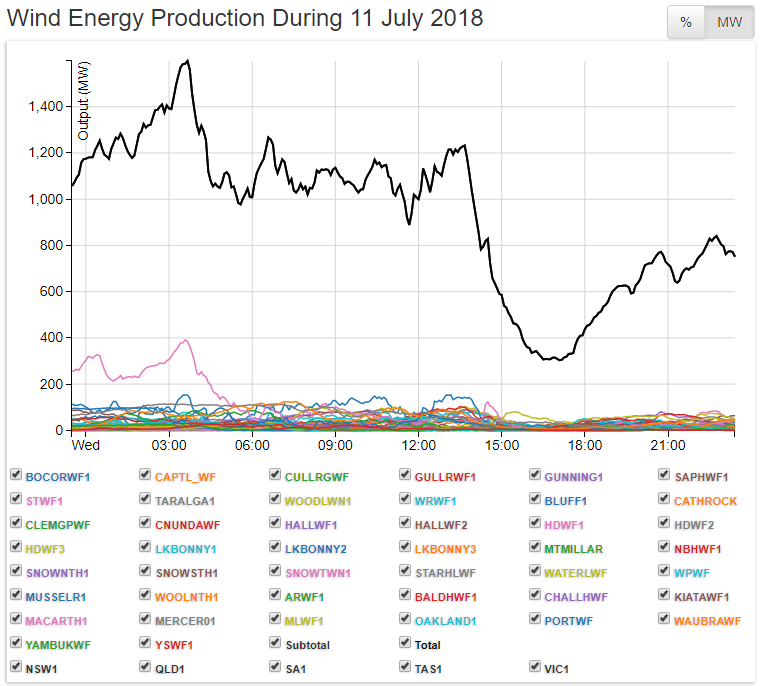
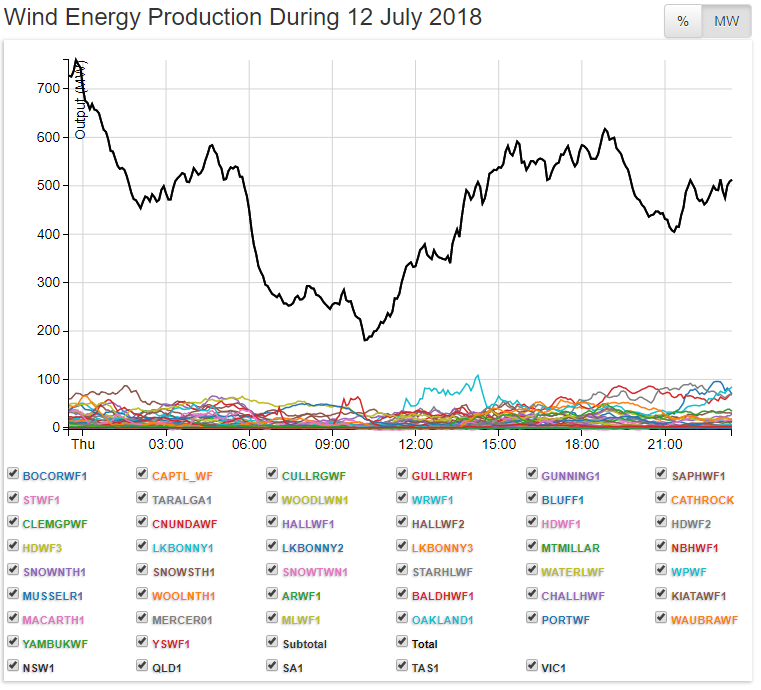
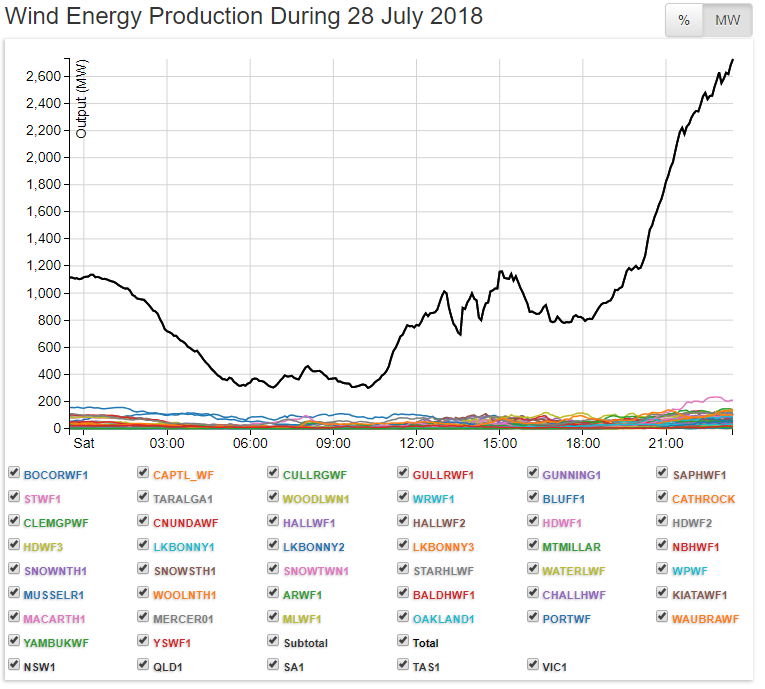
When Anton Lang talks about “wind varying by sometimes hundreds and more MW”, he flatters it. Wind power output frequently surges in magnitudes of 1,000-3,000 MW across the Eastern Grid, and collapses, without much warning, by equally precipitous magnitudes (see the graphic at the start of this post).
The pathetic performance of Australia’s fleet of whirling wonders, detailed above, relates to the Eastern Grid (which excludes WA and the NT).
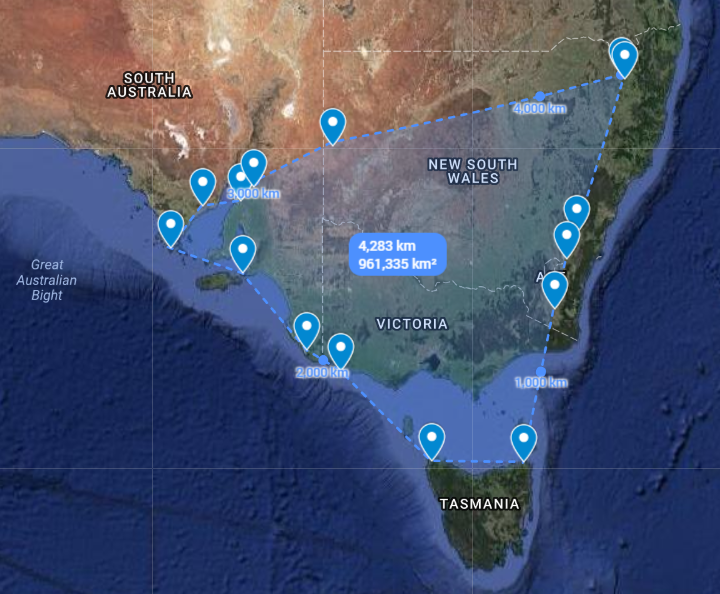
On the Eastern Grid, Australia’s wind farms are located in 4 States – Tasmania, South Australia, Victoria and NSW – and spread from: Hornsdale in the Mid-North, west to Cathedral Rocks on lower Eyre Peninsula and south to Millicent in the South-East of South Australia; down to Cape Portland (Musselroe) and Woolnorth (Cape Grim) in Tasmania; all over Victoria; and in New South Wales, at Broken Hill in the far west, and right up to Glen Innes in the New England Ranges.
There are over 1,800 turbines in 80 odd wind farms (which range from 20-30 turbine clusters right up to the largest collection of 140 at Macarthur in Western Victoria) – that are spread out over a geographical expanse of 961,335 km².
That’s an area which is 4.19 times the combined area of England (130,395 km²) Scotland (78,387 km²) and Wales (20,761 km²) of 229,543 km². Or 1.75 times the 551,394 km² covered by France.
With the help of Aneroid Energy, we’ll finish up with snapshot of their performance over the last few months. As you read on, bear in mind that 200 MW amounts to a trifling 4% of total capacity.

Great post. I’d add a nod to thermal solar which is designed to run into the night using molten salt. Solana in Arizona has a 280MW capacity with bigger projects in the pipeline.
Alex
Here’s a nod to solar thermal. SA signed up to spend $1.2 bn to get 150MW, based on Crescent Dunes with a capacity factor of 52%.
Reblogged this on "Mothers Against Wind Turbines™" Phoenix Rising….
Hello There, Is it possible for you to please do a post showing the total Co2 cost of the manufacture, installation and maintenance of a current wind tower in one of their proposed remote locations.I have heard, or read, that they are placed on a 500 tonne concrete base, and also that they have a motor installed to enable the blades to be turned into the wind, when there is a change of wind direction. Plus there are all-weather roads to be constructed and maintained, etc, etc.All this Co2 generated must therefore require a lengthy pay-back period from the Co2 saved in its operation.I have tried to find this information on various websites to little avail, and hope your research can give me the answer.I think it’s an important counter argument to the “free” power rubbish of the proponents. Regards, Gerald Focken.
Gerald, start with this
It is not as extensive as what you are looking for. We will be covering a German study in upcoming posts, which shows why, despite large wind and solar capacity, CO2 emissions have risen, and will continue to rise in Germany. That is an issue we have covered numerous times, just type CO2 in our search window.
Don't it always seem to go
That you don't know what you've got til its gone
For today's generation Joni Mitchell's words could well refer to Australia's vanishing fleet of reliable and affordable coal generators.
But we are told incessantly that wind and renewables are cheaper. LOLOLOLOL. Candles and kerosene could also be added to the cheap renewable list.
There certainly are a lot stuck in the fantasy of La-La Land that makes fake news easier to disseminate: to the extent of getting breaking stories on mobiles yet never going to check what updates there are on the likes of new developments in nuclear technology.
Commercial aviation is not going away even with all its danger.
Here’s an interview update from Dr Kelvin Kemm on South Africa’s power industry that I thought had some surprising information. http://www.larouchepub.com/other/interviews/2018/4519_kelvin_kemm_interview.html
With Germany going back to coal fired power perhaps they’ll reveal to their citizens exactly how much nuclear produced electricity comes from France.
August is traditionally the windy month here, so we can expects a few rants about how much energy is coming from windmills.
I have photos of the first commercial wind turbine in Australia near Torquay, Victoria and it was rarely turning to supply power to the sewerage outlet. Had it been relied on, there certainly would have been a blockage.
This is an absolutely fantastic series from Anton Lang. His compilation and analysis of Australia’s grid network, is, I believe highly valuable in understanding how our Network is handled, and what little impact solar and wind really has on our generation capacity. This ongoing series has the capacity to be a real weapon in our war against renewables! It blows their arguments and ascertians out of the water. This is straight forward factual information that cannot be refuted!
I highly commend this work by Tony, and suggest you put in your arsenal!
Thanks for taking my Post here.
Speaking of large variations in power, renewables supporters froth at the mouth very time one of those coal fired Units goes off line, calling it a failure, even if it goes off line for scheduled maintenance.
As I have found while doing this Series, now into its twelfth week, each and every time one of those coal fired units goes off line, it is handled very well, with a mix of hydro power and natural gas fired power, so much so, that hardly anyone even notices that a Unit has gone off line. Keep in mind that these Units range in size from 250MW up to 750MW, so, taking out one of those big Units might actually seem problematic, but at each case, it is very well managed.
Now, keeping in mind how those renewable supporters point at the supposed unreliability of those coal fired units because they go off line on occasion, consider what happened over the last two days.
On Wednesday, wind power was lower by 1890MW than it was the day before, that large loss made up from a mix of hydro, natural gas and coal fired power, all up.
On Thursday, wind was back up by 1380MW, and natural gas went way down.
However, coal fired power also went down, mainly due to a problem at the Loy Yang plant, all six Units, and over a period of six hours Loy Yang lost 1600MW in one hit as five Units reduced power to almost half and one Unit went off line. It was handled by a mix of hydro and natural gas fired power, and even with wind back up again, the need for reliable power saw the loss at Loy Yang made up, not from wind, but by plants they could be certain of delivering reliable power when needed.
If it wasn’t for that ‘failure’ at Loy Yang, coal fired power would have been the same as usual.
On all three days, wind up, then down, and then back up again, the total power consumed in those five Eastern States only changed by 100MW on average 23800MW, 23800MW and 23700MW average per hour.
Those changes in wind power occur on a daily basis, and in nearly every case, coal fired power just keeps humming along, doing what it always does, delivering reliable and constant amounts of huge power.
Tony.
Tony, thank you for doing the work. We have read your frequent comments on JoNova with interest over many years. Collecting the data and its analysis as you have done in this effort is notable and illustrative. Keep it up. What RE zealots hate most are facts, keep dishing them up. We will.