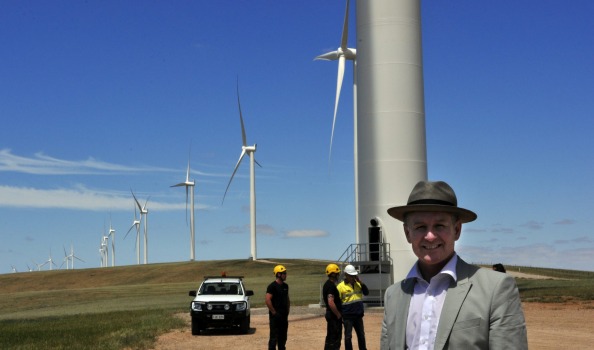
Wind ‘powered’ South Australia is the place where the laws of nature, physics, engineering and economics get turned inside out.
Run by a former worker’s injury compensation lawyer, and a band of equally deluded acolytes, South Australia has become the butt of international jokes, thanks to an obsession with nature’s wonder fuels, sunshine and breezes.
When the sun goes down and wind power output collapses, as it does every single day, SA relies upon anything up to 800 MW of coal-fired power drawn from neighbouring Victoria and NSW via two interconnectors; two large gas-fired generators (the 1,280 MW gas-steam Torrens Island plant and a 440MW CCGT plant at Pelican Point); a few small peaking plants, including piston-engined diesels at Port Stanvac and Open Cycle Gas Turbines at Hallett; and 276 MW of diesel-fuelled Open Cycle Turbines that cost taxpayers $400 million and which chew up 80,000 litres of diesel, every hour.
Oh, almost forgot, Elon Musk’s $150 million, 100 MW mega-battery that’s capable of powering SA for just under four minutes; more like a rounding error in calculating what’s actually powering SA.
Having blown up its last coal-fired plant at Port Augusta last December, and with that menagerie of costly and highly inefficient generation capacity, it’s no wonder that SA pays the highest retail power prices in the world.
Unhappily for SA’s households and businesses, its Premier, Jay Weatherill is prone to policy brain farts.
A couple of weeks ago, it was a ‘virtual’ power plant, said to comprise thousands of solar panels and Tesla batteries which he plans to bolt on to Housing Trust homes (publicly owned, low-rent properties, mostly occupied by pensioners and the terminally unemployed). The cost to taxpayers is north of $1 billion, and the returns in terms of meaningful power, just peanuts.
Along the same lines, clearly panicked renewables rent-seekers have put forward another economic and engineering nonsense, involving pumped hydro proposed for the Adelaide Hills.
Hardly the Himalayas, and more like humps than hills, the Mount Lofty Ranges to the East of the City are the most unlikely place for another Snowy Hydro Scheme. Indeed, as David Bidstrup details below, what’s being put up will turn out to be yet another risible response SA’s renewables debacle. We’ve added a few pics care of Aneroid Energy to help David make his point.
Will “pumped” hydro save us?
Catllaxy Files
David Bidstrup
12 February 2018
Two reports in the Adelaide “Advertiser” caught my eye. One was headlined “Hydro to keep our electricity pumping” and the other concerned another billionaire who wants to save us – “Gupta pledges to fix SA’s energy debacle”. At least he was right in describing it as a debacle.
The hydro article lists five proposed “pumped hydro” schemes and lists capacity and output for each, but fails to mention how much water might be needed and that the schemes are nett users of electricity rather than generators.
Mr Gupta says he will install “one gigawatt of dispatchable renewable energy” which will power his Whyalla steelworks and have a bit left over for the rest of us. The articles confuse power with energy; the reporters constantly claim we “use MW”. Clearly they have no idea what they are talking about. The critical question is how long Mr Gupta’s “one gigawatt” will produce electricity for.
It is interesting that there are two mutually exclusive terms used; renewable and dispatchable.
I thought I would analyse the 5 hydro proposals to see how much they can provide as a percentage of average daily consumption, how much electricity they need to re-fill the dams and how much water is needed to run them.
The following analysis is based on a head difference of 150 metres. This is a bit generous but I do not have access to enough detailed topography. Remember, Mt Lofty is only 711 metres high and it is the second highest peak in SA.
The table below lists the 5 schemes and shows installed capacity, water flow required in cubic metres per second, stated output in MWh, the time each needs to operate to achieve that output and the total quantity of water in Megalitres for that time period.
| Scheme | Capacity MW |
Water flow M3/sec |
Output MWh |
Hours | Total water, Megalitres |
| Goat Hill | 230 | 174 | 1,840 | 8 | 5,000 |
| Baroota | 200 | 162 | 1,600 | 7.5 | 4,350 |
| Cultana | 225 | 170 | 1,770 | 8 | 4,800 |
| Iron Duchess | 90 | 68 | 390 | 4.5 | 1,060 |
| Highbury | 300 | 226 | 1,200 (see* below) | 4 | 3,260 |
| Totals | 1,060 | 6,800 | 18,500 |
(*: Cannot confirm this number but have seen it somewhere).
South Australia’s average daily power consumption is 31,600 MWh so the total output of the 5 schemes above can contribute 21% but they require the equivalent of 24% to pump all that water back uphill, so they are nett energy users, not generators.
The total cost quoted for the 5 schemes is $1.86 billion and the result is a deficit in power available for consumption. We are told that they will use “spare capacity” from wind farms and perhaps some solar installations to provide their pumping power. Today at noon wind was producing 1.25% of the total grid load.
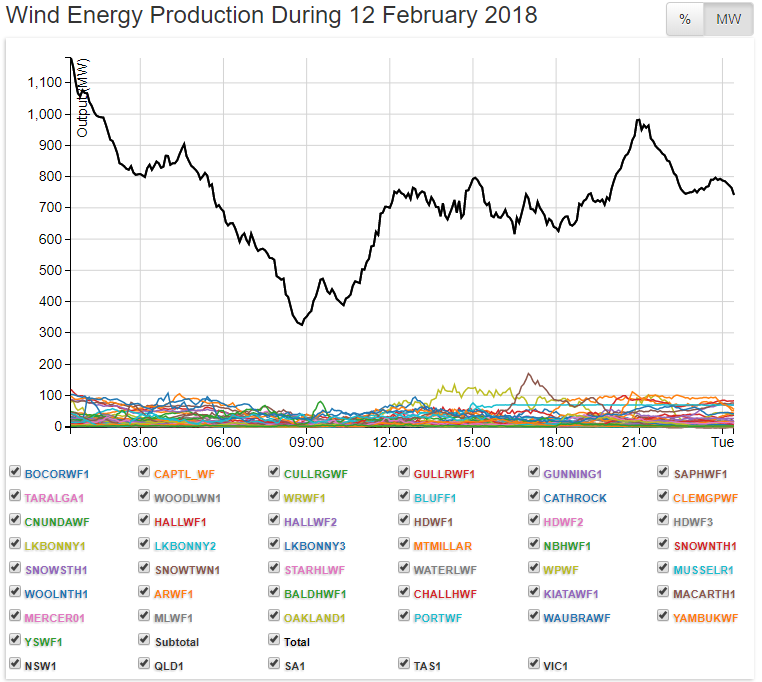
[Total output from all wind turbines on the Eastern Grid, notional capacity of 4,360 MW]
In SA we managed half of that, running at 250-400 MW. This is common during summer and lots of wishful thinking will not change it.

[Total output from all wind turbines in SA, notional capacity of 1,698 MW]
My recent article on a proposed solar farm indicated the minuscule amount they can provide [reproduced below].
Adelaide’s average daily water consumption is about 550 Megalitres per day so the schemes require about 33 times this amount to be stored in “turkey’s nest dams”, an appropriate word. Where will this come from in the “driest state”?
If we consider a dam of 100 hectares surface area the depth of water needed for the largest scheme is 5 metres. Intakes must be submerged below the minimum level otherwise they will suck air so the full depth will be even greater. Also evaporation of around 3 metres per year needs to be considered.
There is some naive idea that these schemes can be a bit “agricultural”, just get some gear and build a couple of “turkey’s nests”, get some pipes and turbines and Bob’s your Uncle. The reality is very different, having been involved in a couple of hydro-electric schemes myself.
There is also the added cost of transmission and the complexity of running these things on the fly whenever we are a bit short of juice.
The point that is never mentioned is that the destruction of the Playford B and Northern power stations removed 760 MW of generating capacity, 76% of “one gigawatt”, and it was available every day of the year, night and day, windy or not. None of the proposed schemes can come within a bulls roar regarding economy and reliability and neither can wind and solar. We should remember that when we hear all the bullshit sprouted about “renewables” and recognise that it is all political and has no technical merit at all.
All this pain is to “reduce emissions” when there is plenty of evidence that it is a pointless exercise and that we actually do not have a problem called “anthropogenic global warming”. How do we get off this train to the madhouse?
Catallaxy Files
Here’s David’s take on another engineering and economic nonsense being pitched to South Australians (at their ultimate expense, of course).
Solar nightmares
Catallaxy Files
David Bidstrup
11 February 2018
A report on 8 February told of a plan to build a 44 MW solar system “to deliver more reliable power to the grid”. The cost would be $90 million.
I have done some research into solar systems, so thought I would look at this proposal from a state wide power consumption viewpoint.
Using AEMO numbers the daily average power consumption in SA for 2017 was 31,600 MWh.
Using a solar calculator that takes information from stations that record Typical Meteorological Year (TMY) data on solar insolation, cloudiness, temperature and whatever, the 44 MW solar system might generate 69,800 MWh in a year.
Averages are misleading and do not reflect the reality that solar system output declines significantly throughout the year as the sun angle changes in the sky. When the output is shown as monthly figures the picture becomes a bit clearer.
In summer, (December, January and February) average daily output is 252 MWh. In autumn, (March, April, and May) it is 168. In winter, (June, July and August) it is 123 MWh and in spring, (September, October and November) it is 224 MWh.
The table below shows the comparison between daily average consumption and the contribution from the solar farm.
| Season | State average daily consumption MWh | Solar contribution MWh | Solar contribution as % of daily consumption |
| Summer | 31,806 | 252 | 0.79% |
| Autumn | 31,740 | 168 | 0.53% |
| Winter | 35,043 | 123 | 0.35% |
| Spring | 27,983 | 224 | 0.80% |
The output never gets to 1% of the daily consumption and when we consider the times that output is delivered it gets worse.
In January the system operates for about 11 hours but output does not become significant until around 9 a.m. and declines after 3 p.m. 90% of the daily output is between those hours but is not a constant amount ramping up from 10% at 9 a.m., reaching 13% at 12 noon and declining to 9% at 3 p.m.
In June nothing happens until 8 a.m. when output is 8%. It ramps up to 20% at noon and then falls off the cliff at 2 p.m.
How this contribution gives “more reliable power to the grid” is beyond me. The proponents also promise a “21 MW battery” which is a nonsense statement – how long will that battery be able to supply energy (MWh)? Probably 5 minutes.
People often confuse power and energy and think that “adding 44 MW” to the system means something rather than looking at things in the context of the contribution to consumption, (MWh). In this case, that contribution is negligible, variable, and intermittent and of no real use except for the proponents to garner renewable energy subsidies, without which there would be no business case.
Catallaxy Files


Well i guess you’re now eating humble pie, and will soon be on dry bread and water, such rubbish, from people who should have known better
Here’s a reality check from Ontario. When our government gave 5 grants for experimental storage facilities ( air pressure in salt caverns, flywheels and pumped storage among them ), I asked in a public forum what would be wrong with pumping water back over Niagara Falls into Lake Erie ( 20,000 square kilometres in size ) whenever there was excess wind or solar generation. The answer, from a very knowledgeable source: ” the water volumes required would be such that water levels on the lake would vary so much that other traditional uses of the lake, like shipping, recreation, coastal protection would be compromised “.
Others proposed filling and emptying abandoned mine shafts using excess electricity, requiring large dammed storage on the surface. There too, the very volume of water required sank the projects. Costs were never even mentioned.
As an intervenor advocating for the California ratepayers and the environment before the California Public Utilities Commission (CPUC) in Application A.16-08-006, Californians for Green Nuclear Power, Inc.(website is CGNP dot org) has analyzed the environmental “benefit” of more than 6,000 MW of California’s wind generation. Because the Capacity Factor (CF) of wind is only about 20% of the time, the multi-billion dollar cost of that huge amount of wind power is negligible, as 6,000+ MW of fossil-fired generation is required t to compensate for such a low CF. This should help readers to understand why the fossil industry avidly endorses both solar and wind. (The more than 10,000 MW of California solar photovoltaic power ALSO shows a low CF of about 20%.) . . . . . . . . . . . . . . . . . . . https://tinyurl.com/Wind-And-Solar-Scam . . . . . Here is the real reason for such policy advocacy from an economic elite, Warren Buffett. . . . “For example, on wind energy, we get a tax credit if we build a lot of wind farms. That’s the only reason to build them. They don’t make sense without the tax credit.”
“Big Wind’s Bogus Subsidies – Giving tax credits to the wind energy industry is a waste of time and money.”
By Nancy Pfotenhauer, Contributor |May 12, 2014, at 2:30 p.m US News & World Report . . . BTW, CGNP’s testimony that documented in the above CPUC Application the dangers of hydropower using California’s Oroville Reservoir as an example – and the Taum Sauk Pumped Storage facility was disallowed by the CPUC following criticism by the Applicant Pacific Gas & Electric (PG&E.) Clearly, raising safety concerns regarding hydropower and pumped storage is not allowed by fossil-fuel advocates. 😦
Gene I presume you know that nuclear power generation is illegal here in Australia. Similarly in two states, Victoria and New South Wales, the use of hydraulic fracturing for gas extraction is outlawed, in Victoria even conventional gas extraction is banned.
For many years Australia relied on the plentiful availability of coal for pretty much all of its base load electricity generation, with little economic incentive to introduce nuclear power.
But the “progressive” Green/Left that now holds sway here in governments, government bureaucracies and science agencies has decreed that only ideologically pure methods of generation (i.e. wind and solar) will be used. Coal is still plentiful in Australia, in fact we export massive amounts overseas but a mass of anti-coal, renewables legislation and Green energy subsidies is forcing the coal generators out of business.
Australia is also rich in uranium and exports significant quantities of uranium oxide overseas, but as I mentioned it is “verboten” when it comes to local electricity generation. So you might say Australia is not even near the starting line when it comes to thinking seriously about nuclear power.
Just as in California, when ideology trumps scientific and engineering analyses, the ratepayers are stuck with incredibly expensive electric power. As I note above, the real economic beneficiary of this ideology is the fossil fuel industry. Solar and wind generation serve as public-relations diversions from the increasing amounts of fossil fuel that are being burned each year to support California’s huge energy needs – if it were a nation, it would rank as the sixth highest energy user in the world. . It is likely that fossil fuel interests helped to pay for the legislation that disadvantages and opposes nuclear power. since nuclear power is the only energy source that challenges the California market dominance of fossil energy.
SA is a mess, it is led by a Government that’s been running around trying to hide the fact they were fooled and incapable of listening to rational concerns about the push for ‘renewables’ in the form of big fans, that they did not want to accept this form of producing electricity for our needs was nothing but in a political sense a foolish ideology and for the industry a money making mechanism – well worth them hugging our Premier and his underlings.
Now these politicians are running around looking for ways to cover their backs with a mishmash of projects and pushing them out with smiles and fingers crossed that they can continue to fool at least some of the public.
People are beginning to understand the need for base-load energy production is a necessity in a modern nation.
We still have those who live in a mental state of fairyland, but more are seeing beyond the twinkling fairy dust that’s sprinkled and spread by the thrashing turbines.
So many announcements being made of how we can produce electricity and how it can be saved for future use, is now being recognised as a frantic effort to save the Government not the State.
Examiner throws cold water on Xcel wind plan. https://www.google.com/search?q=Examiner+throws+cold+water+on+Xcel+wind+plan&rlz=1C1CHBF_enUS756US756&oq=Examiner+throws+cold+water+on+Xcel+wind+plan&aqs=chrome..69i57j69i60j69i61.2896j0j7&sourceid=chrome&ie=UTF-8
SA not the only fools.
Portland the home of renewables manufacturing, as usual are in a green blinded, dumb ass race to be Victoria’s ‘renewable capital’ was also opting wind turbine ravished Cape Bridgewater as a site for pumped hydro.
https://www.spec.com.au/2017/03/pumped-hydro-option/
No further news on this, and no news is good news!