Thanks to its ludicrous attempt to run on sunshine and breezes, South Australia has just experienced yet another Statewide blackout. SA’s vapid Premier, Jay Weatherill and what passes for media in this Country ran straight to the periphery, blaming everything except the bleeding obvious (see this piece of infantile doodling from wind cult central – the ABC).
STT’s SA operatives tell us the blackout occurred during a blustery spring storm (heavy rain, lightning and surging, gusty wind). The power supply went down across the entire State at precisely the same time (a little after 3:30pm). It took more than 5 hours to restore power to a few parts of the State, and many regions remained powerless for much longer than that.
True it was that lines were damaged in the mid-North around Port Augusta, but that doesn’t explain why the whole State’s supply went down. Grids are designed with a level of redundancy, and to avoid complete collapses by isolating damaged sections, in order to keep the balance up and running.
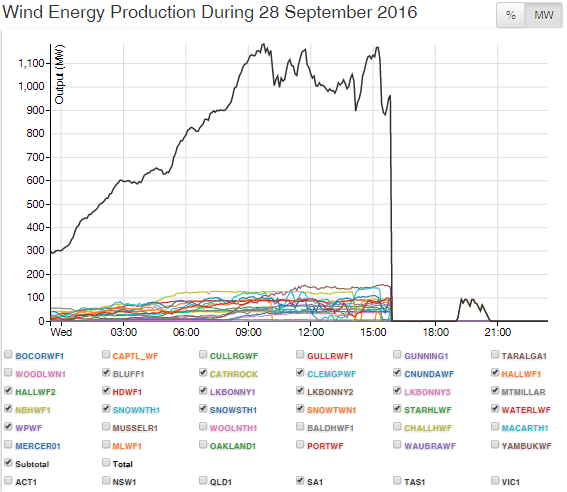
For those truly interested in the cause, what appears in the graph above – care of Aneroid Energy – gives a clue as to the culprit.
SA’s 18 wind farms have a combined (notional) capacity of 1,580MW.
On 28 September (aka ‘Black Wednesday’), as the wind picked up, output surges by around 900MW, from a trifling 300MW (or 19% of installed capacity) to around 1,200MW.
As we explain below, electricity grids were never designed to tolerate that kind of chaos, but it’s what occurs in the hour before the collapse that matters.
From a peak near 1,200MW, there are drops and surges in output of around 250-300MW (equivalent to having the Pelican Point Combined Cycle Gas plant switched on and off in an instant).
At about 2:30pm there is an almost instantaneous drop of 150MW (1,050 to 900MW), followed by a rapid surge of around 250MW, to hit a momentary peak of about 1,150MW.
Then, in the instant before the blackout, wind power output plummets to around 890MW: a grid killing collapse of 260MW, that occurs in a matter of minutes (it’s all happened before, as we detail below). That 260MW collapse was the deliberate result of an automatic shutdown of the wind farms based in SA’s mid-North, located in the path of the storm front: the final and total collapse in SA’s power supply follows immediately thereafter.
In a repeat of what occurred on 1 November last year, that sudden, unpredictable drop in wind power output placed an exponentially increasing load on the interconnectors that supply SA with meaningful base-load power from Victoria’s coal-fired plant in the Latrobe Valley. The interconnectors, faced with rapidly increasing loads, that fast exceeded their thermal limits, shut down as a means of self-protection (for detail on the 1 November event – see our post here). There followed a complete collapse of the grid in SA.
Wind turbines produce no power at all until the wind speed reaches a constant 5-6m/s; when the wind really gets blowing and hits around 25m/s – as it did on 28 September – turbines automatically shut down to protect themselves from permanent structural damage: 11 tonne blades being flung about the countryside isn’t just a PR nightmare, it tends to impact on the unit’s operational capacity thereafter.
In the aftermath there was plenty of waffle about the system shutting down to ‘protect itself’: indeed it did.
But it was SA’s mid-North wind farms that were in damage control. Neigbouring Victoria was also battered by the same storm, but – perhaps due to the fact that it chugs along with ample capacity from reliable coal-fired plant and has a tiny amount of wind power capacity by comparison with SA – didn’t suffer anything like SA’s date with the Dark Ages.
During the blackout and in its aftermath, STT’s site was inundated by hits from South Australians looking for answers (no doubt on half-charged smart phones, while sitting freezing in the dark); using search terms such as: sa blackout cause; sa vic interconnector problems; south australia blackouts; south australia in turmoil; sa blackout wind responsible; sa premier blackouts; and south australia electricity chaos.
For those South Australians still looking on the internet (power supply permitting) for answers as to why their grid collapses on a regular basis, here is a primer on power generation for dummies.
There are 3 electricity essentials – that the power source and its delivery to homes and businesses be: 1) reliable; 2) secure; and 3) affordable. Which means that wind power – a wholly weather dependent power source, that can’t be stored and costs 3-4 times the cost of conventional power – scores NIL on all three counts.
As the wind power calamity unfolds in South Australia, all comers (including mainstream media hacks) are starting to take an interest in electricity generation which – before South Australia’s recent experience of statewide blackouts, routine load shedding and skyrocketing power prices – was something that the last few generations of Australians have taken for granted.
In an effort to educate, STT has attempted, once or twice, to lay out the electricity generation basics in clear and simple terms – that even journalists might understand.
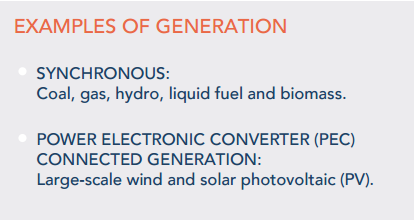
We’ll start with this insight from the AEMO about what’s required to maintain the integrity of a functioning electricity grid. [Note that the term Power Electronic Converter (PEC) is the euphemism used for wind and solar power generation.]
Fact Sheet: System Strength
AEMO
What is System Strength?
System strength is an inherent characteristic of any power system.
System strength is important as it can materially impact the way a power system operates.
System strength is usually measured by the available fault current at a given location or by the short circuit ratio (the ratio of the short circuit current at a point in the grid with the current at that point under open circuit conditions and with normal voltages).
Higher fault current levels are typically found in a stronger power system, while lower fault current levels are representative of a weaker power system.
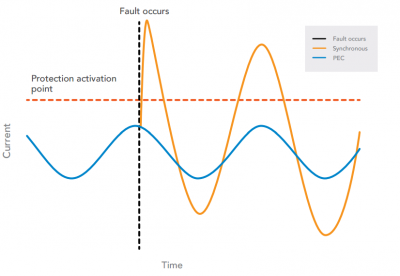
A high fault level, or high currents following a fault, could be viewed as the generation on the grid responding strongly to the drop in voltage at the fault – trying to restore the situation. Similarly a high short circuit ratio at a point in the grid is a measure of the strength of the response to any faults in that area.
Fault currents vary around the grid both by location and by voltage level. The fault currents are higher in areas close to synchronous generation and lower in areas further away from this generation. System strength reduces with increasing amounts of power electronic converter (PEC) connected generation, along with the displacement of synchronous generation which contributes more to the fault current.
What are the Characteristics of Strong and Weak Systems?
Power systems with a high quantity of on-line synchronous generation and very little PEC connected generation provide larger fault current and are categorised as strong systems. This is manifested by the ability of the power system to maintain stability in response to various types of disturbances.
Parts of the power system with PEC connected generation which are distant from synchronous generation are more likely to be weaker. Low system strength generally leads to increased volatility of network voltages during system normal and disturbance conditions. Low system strength can also compromise the correct operation of protection systems, and result in PEC connected generation systems disconnecting during disturbances.
Some weak systems are easy to identify, for example, an isolated part in the system with no nearby synchronous generation. In other parts of the power system where there is multiple concentrated PEC connected generation, weak systems can only be identified through complex power system studies conducted by engineers using detailed models.
Voltage Management in Strong and Weak Systems
Strong power systems exhibit better voltage control in response to small and large system disturbances. Weak systems are more susceptible to voltage instability or collapse.
Increasing Connection of PEC Generation (Wind Turbines)
Generation that is interfaced to the network using PECs requires a minimum system strength to remain stable and maintain continuous uninterrupted operation. Different types of converters use different strategies to match their output to the frequency of the system while maintaining voltage levels and power flows. In a weak system, these can fail to operate correctly through even relatively minor disturbances.
Operation of Protection Equipment in Weak Systems
While weak systems are not new to system operators, they are attracting greater attention following the rise of large scale PEC connected generation in the power system (more wind turbines. Protection equipment within power systems work to clear faults, prevent damage to network assets and mitigate risk to public safety.
Protection equipment may be triggered when the current following a fault exceeds the protection activation point, or by the impedance calculated from this current. Weak systems exhibit lower fault current relative to the strong networks. In a weak system, protective equipment which is programmed to activate on measured current or the ratio of measured voltage to current, could be susceptible to unintended operation or failure to operate.
So much for the principle and theory, now let’s take a look at an inherently ‘weak system’ – thanks to the experiment being conducted in South Australia:
The price of living with ‘PEC’ – ie trying to run on sunshine and breezes – is paid for with wrecked electrical appliances and – when the system shuts down to protect itself from wind power surges and collapses – the failure of whole local systems.
The latter has been part and parcel of life for commuters on Adelaide’s Seaford/Tonsley electric train line for months now: South Australia – Wind Powered Train Wreck: Power Supply Chaos Strands Thousands of Commuters
While the wind industry, its parasites and spruikers keep talking about ‘integration’ of their beloved power source, the actual result is ‘disintegration’: of local systems within the grid (eg the Seaford/Tonsley line); and collapses of the entire grid: Wind Industry’s Armageddon: Wind Farm Output Collapse Leaves 110,000 South Australian Homes & Businesses Powerless
In the video that follows, an electrical engineer, Andrew Dodson explains in detail the lunacy of trying to distribute wind power via a grid deliberately designed around on-demand generation sources.
STT recommends it to anyone with even the vaguest interest in how our electrical grid works (and that must now surely include anyone unlucky enough to hang their hat in South Australia, including the Seaford/Tonsley line’s ‘occasional’ commuters).
At the simplest level, think of our distribution grid as akin to a mains water distribution system. In order to function, the pipes in such a system need to be filled at all times with a volume of water equal to their capacity and, in order to flow in the direction of a user, the water within the pipes needs to be maintained at a constant pressure.
Where a household turns on a tap, water flows out of the tap (in electrical terms “the load”); at the other end an equal volume of water is simultaneously fed into the system and pumps fire up to maintain the pressure within it (although gravity often does the work).
In a similar fashion, an electricity grid can only function with the required volume of electricity within it; maintained at a constant pressure (voltage) and frequency (hertz) – all of which fluctuate, depending on the load and the input.
What Andrew Dodson makes crystal clear is that these essential certainties (essential, that is, to maintaining a stable and functioning electricity grid) have been tipped on their head, as a result of the chaos delivered by wind power.
****
****
What Andrew has to say about wind power, in general, has special pertinence to Australians, not just South Australians.
The Federal Coalition government helped lock in a $45 billion electricity tax – which is to be directed at wind power outfits; and for no other purpose than to help them spear another 2,500 of these things all over the country.
And more so with Labor’s ‘Electricity’ Bill Shorten crowing louder than ever about a ludicrous 50% RET, the number would need to be in the order of 10-12,000 of them. Never mind the cost; and never mind what happens to the stability of the grid.
As Andrew Dodson points out, grid stability (frequency and load balancing) matters. Back in 2012, Australia’s Paul Miskelly (another highly experienced Electrical Engineer) ripped into the patent nonsense of wind power in his paper Wind Farms in Eastern Australia – Recent Lessons – published in the journal, Energy and the Environment. On the risk to grid stability from attempting to integrate intermittent and highly variable wind power output into Australia’s Eastern grid, Paul wrote:
PROPERTIES OF ELECTRICITY GRIDS
On an electricity grid supply and demand must be maintained in balance on a second-by-second basis (AEMO, [6]). Kirby et al [7], for example, in discussing these fundamental concepts, state:
“Small mismatches between generation and load result in small frequency deviations. Small shifts in frequency do not degrade reliability or markets efficiency although large shifts can damage equipment, degrade load performance, and interfere with system protection schemes which may ultimately lead to system collapse.”
Bevrani et al [8] discuss control parameters and strategies in detail and stress that any degradation of electricity grid control system safety margins will result in frequent, unscheduled, widespread blackouts (“system collapse”). A recent German government report highlights the likely catastrophic consequences resulting from any such event.
In South Australia, wind power output fluctuations (rapid surges and precipitous collapses) mean that “the [massive] mismatches between generation and load result in [huge] frequency deviations” – with “widespread blackouts”; which has “degraded load performance”, and led to a dangerously unstable power supply.
STT’s operatives inform us that the wide range in supply voltage caused by wind fluctuations has seen the grid managers in SA (SA Power Networks) reduce the voltage running in the grid to 220 Volts (the Australian Standard is 240). Ordinarily, the system is set to operate at 230 Volts, allowing for normal – load driven – fluctuations above and below that level, such that the upper limit never exceeds 240. Surges above 240 Volts put appliances (especially electronics) at risk of permanent damage. Now, with massive wind power surges a daily feature of SA’s power supply, the grid operator is faced with frequent and rapid rises in voltage; and has adjusted the operating voltage downwards to accommodate it.
So far, so technical. But what really matters is having power whenever and wherever you need it. As Joni Mitchell pondered in her 1970 hippy-hit-classic, Big Yellow Taxi, ‘Don’t it always seem to go, That you don’t know what you’ve got ‘Till it’s gone’.
During the mass blackout on 28 September, the politicians that put South Australia on the map (for all the wrong reasons) and the useful idiots in SA’s media that helped them, were all left sitting freezing in the dark, while they pondered where it all went wrong.
Welcome to your wind powered future!


Why no research into clean burn coal?
Aus has a lot of coal – research is needed, but never any funding.
Hi,
I started a petition “SA PREMIER JAY WEATHERILL : Demand the RESIGNATION of the Energy Minister for HIGH POWER PRICES CAUSING SA’s JOBS CRISIS and 15,000 household POWER DISCONNECTIONS, frequent POWER BLACKOUTS and the JULY 2016 POWER CRISIS” and wanted to see if you could help by adding your name.
Our goal is to reach 100 signatures and we need more support.
You can read more and sign the petition here:
https://www.change.org/p/sa-premier-jay-weatherill-demand-the-resignation-of-the-energy-minister-for-high-power-prices-causing-sa-s-jobs-crisis-and-also-15-000-household-power-disconnections-frequent-power-blackouts-and-the-july-2016-power-crisis?recruiter=135406845&utm_source=share_petition&utm_medium=email&utm_campaign=share_email_responsive
Please share this petition with anyone you think may be interested in signing it.
Thankyou for your time.
STT, your screen shot of Aneroid’s graph for 28th Sept. shows the drop off at around 15:30, as you say. The graph at their site NOW shows the drop-off occurring at 16:30, which aligns AEMO’s press release bruiting the cause of the shutdown to be that of transmission line damage. Am I missing something here… or did Aneroid “cook” the graphing tool in order to confirm the “nothing-to-do-wind-energy” narrative?
No it doesn’t. We’ve just gone to Aneroid and the graphic is identical to the screen grab we took on Thursday.
It shows the spike and collapse in wind power output at 3pm (15:00) and the total collapse of the grid thereafter at approx 15:30:

Aneroid collects and reports data gathered by AEMO. Nothing cooked about that. If there is some time issue it may be 30 minutes allowing for the SA time zone difference to the Eastern States. So what’s your point?
My apologies, STT, I realised later it may be a time difference issue, I’m looking at it from Victoria. In fact the AEMO media statement by also gives the outage time in Australian Eastern Standard Time (16:18). Sorry, once again.
Can anyone provide a source for what time the 3 Transmission Lines and 20 odd Transmission Towers were brought down? This is of critical importance. The state lost power at approx 3.39PM. If those lines and towers came down at a different time, then it puts a major hole in the official line of argument.
The SA wind turbines were all disconnected between 4:15pm and 4:20pm. They were all nearly running at 100% CF. The question that needs answering is this:
Turbines switched off because of too much wind or because the transmission lines fell down at that exact time?
JA, the power went out at around 3:40pm SA time, the times you are referencing must be in another time zone?
In the minutes before the grid collapse, SA’s wind power output spiked to around 1,150MW (or 73% of its total installed capacity of 1,580 – not the ‘100%’ you suggest), with its mid-North wind farms automatically shutdown as the front hit and wind speeds approached 25m/s, output collapses by 260MW to 890MW (or 56% of its total capacity), nowhere near 100% of capacity. So, what was your point?
One issue with wind is that sudden drops result in strain on the system. Once one safety system triggers, it creates a waterfall of cut out down the line. They all need then to be reset manually. This is what happened in Scotland a couple of years back. Since then there has been millions spent on re-enforcing the system. Now it is easier to compartmentalise the blackouts.
Australia has the same ‘system’. But, for some strange reason, it’s only South Australia that suffers routine load shedding and mass blackouts, but that could just be the weather…
Doesn’t geothermal produce synchronous power?
Yes it does, in volcanically active New Zealand and Iceland, but not in Australia.
Isn’t there geothermal in Birdsville?
And volcanically active Phillipines and Indonesia. Actually Chevron is the greatest producer of geothermal energy, after taking over UNOCAL in 2005.
We are trusting these people to administer everything to do with our lives, including food, finance, education & wars, obviously there’s something pickled about their brains; look at Tasmania & the Italian Bass Strait cable fiasco after they tried to make money from lowering the hydro dams reserve.
We’re following the USA that doesn’t even have a spare very high voltage transformer, one of the few could fail & take out most of the US supply. Being made in Taiwan, it takes 12 months to construct one.
Hallelujah & praise the powers that be – obviously it’s no different here.
Ireland (with a similar level of wind worship) curtails its wind power if it exceeds 55% of demand, probably a figure designed for normal operation, probably not suitable when there is the likelihood of infrastructure damage in a storm, see section 3 of:
Click to access OperationalConstraintsUpdateVersion2_40_July_2016.pdf
What a good read. Thank you.
But how many politicians in either SA, or the Federal Govt, will make the effort now to educate themselves in the fundamentals of power generation that too many take for granted.
Hopefully, if they value their political future, lots will now do so following the lessons delivered in such dramatic circumstance relative to the disastrous SA performance of Black Wednesday 28th Sept 2016!
The ‘Unreliables’ of wind & solar technology are simply not compatible with a power grid designed to deliver highly reliable 24hours/day performance criteria. If they are to remain part of the energy mix, then they must be required to meet minimum performance standards & commercial arrangements, no less than those applied to the fossil fuel industry (ie coal & gas) that do deliver reliable base load power generation 24hours/day.
Things are going swimmingly here in SA at the moment. Talking to a mate who told me he has a relation that works at Whyalla’s Arrium plant. Apparently yesterday the workers had a vote on whether to have a pay cut. The vote was postponed as hardly any workers turned up as they weren’t getting paid to!
In the meantime Premier Weatherill who is normally hiding in the shithouse when the fighting is on is now doing the media circuit, I wonder whether even Turbo Tom the energy minister left him to defend the state-wide blackout debacle.
Unfortunately in the end result Labor will be sent packing (Liberals aren’t much better) and the people of SA will be left with a chaotic and expensive power network.
The writing was on the wall here in SA, turbines were working like crazy then one – Snowtown1 suddenly dropped off, that was in the morning, it came back up just as all the turbines took a nose dive and stayed down – that is except for Snowtown1 which managed to rise again for a short while.
We were all aware of the weather conditions being forecast, but no one in the energy or wind industry thought to start shutting the turbines down or off in a controlled gradual process to prevent a catastrophic effect of a sudden loss of energy in the system. Combined with this was apparently the Gas plant being hit by lightening.
Why did the wind industry NOT take precautions, why did they just keep operating as hard as they could – was it because they were in competition with each other wanting to make as much money as they could during this period.
How much damage was done to the Gas plant or was there any damage? No one has been asked that question by the media and our insipid Premier of course would not offer such information even if he new it. High voltage power towers and cables down, but somehow they can manage to get energy flowing again? Not that I don’t appreciate having it back.
The Lower SE did not have the weather conditions of the rest of SA, there were not problems with the cabling but yet it took until around 6am to start to get some areas up and running and some parts of Mt Gambier are apparently still waiting this afternoon.
Our Premier says the system operated as it should – but what system do we have? Do we have one or does SA just have a disjointed snaking of installation of energy productions towers with no thought or design or consideration of dangers and possible disruption, a system operated by private companies with the belief they cannot be challenged, that they can operate as they wish – of course we do its a system of chaos a system of greed and lack of planning and thought – we have a system promoted by our succession of Labor Governments who operate to make themselves look good and please the opportunistic industry moguls – the results are coming home to roost and the people in Adelaide are now beginning to understand what we have been telling them for years – these things are a disaster.
“That 260MW collapse was the deliberate result of an automatic shutdown of the wind farms based in SA’s mid-North”
Do you have any evidence for this? This area is also where the HV towers were torn down at the same time.
Zytheran, it’s a matter of forensic logic. The output data shows the collapse in output we refer to precedes the total collapse. All wind farms ceased to dispatch once the grid went down. The sudden 260MW drop in wind power output meant the load on the interconnectors increased beyond their thermal capacity and they shut down to avoid damage – the same situation occurred on 1 November last year: https://stopthesethings.com/2015/11/08/wind-industrys-armageddon-wind-farm-output-collapse-leaves-110000-south-australian-homes-businesses-powerless/
Beyond forensic logic, our sources in the mid-North noted turbines being shut down in the moments before the blackout as wind speeds picked up. The same thing happened in July: https://stopthesethings.com/2016/07/20/south-australias-wind-power-debacle-leaves-labor-government-begging-for-baseload-power/
If you wish to investigate the operation of a particular wind farm, then go to http://energy.anero.id.au/wind-energy
Use the boxes to select/deselect the wind farm or state of interest and you can identify output (or no output as is often the case).
The automatic shut down of wind turbines in high winds is a self-protection measure that is designed to prevent damage to bearings and blades: it’s a fact that doesn’t need evidence.
“The sudden 260MW drop in wind power output meant the load on the interconnectors increased beyond their thermal capacity”
…so you are claiming that this was the root cause of the cascade? How come this doesn’t always happen when the wind speed gets high and they shut down? Looking at the data in previous months or the rest of september this isn’t the first time a rapid drop like this has occurred. What was different about Wednesday?
You apparently didn’t read the post about the November blackout, when there was no storm. The same grid failure was exhibited, but due to a very rapid drop in wind power output. SA also experiences regular regional blackouts aka load shedding as a result of its intermittent wind power supply. Why not keep reading more of our posts on SA, we also report on national and international research on the consequences of attempting to run on wind power, and our critiques are from electrical engineers and economists, rather than Arts grads and Journalists.
Chris Uhlmann of the ABC had a very sharp article on their site today entitled ‘SA storms: Rushing to renewable energy targets puts sector’s reputation at risk’ . It appears to be an insightful and balanced analysis, in the STT spirit! And true to form, the ABC seem to be trying to bury their own senior journalists objective reporting. And offer repeats of the slippery premier’s forked (lightening?) tongue in action. Bring on an independent review that uses engineers and keeps the politicians and climate troughers out of the spin.
Thanks STT for continuing to courageously tell the truth.
Mark Twain said “It’s easier to fool people than to convince them that they have been fooled.” How true this is. How long will it take for the fools to wake up? Thanks STT!
A simple fact about wind power is that when there is little or no wind, the turbines do not work. But the turbines also shut down at wind speeds in excess of 90klm per hour. Where this gets interesting is that the wind farm can be operating at near capacity when all of a sudden the turbines shut down. To illustrate the point please note the brief footage of the Pacific Hydro Cape Bridgewater turbines contained within this interview with a local nearby resident on STT TV. It is located at 4m 33sec into the video. It is brief but it illustrates how the turbines feather themselves in high winds.
Reblogged this on Wolsten.